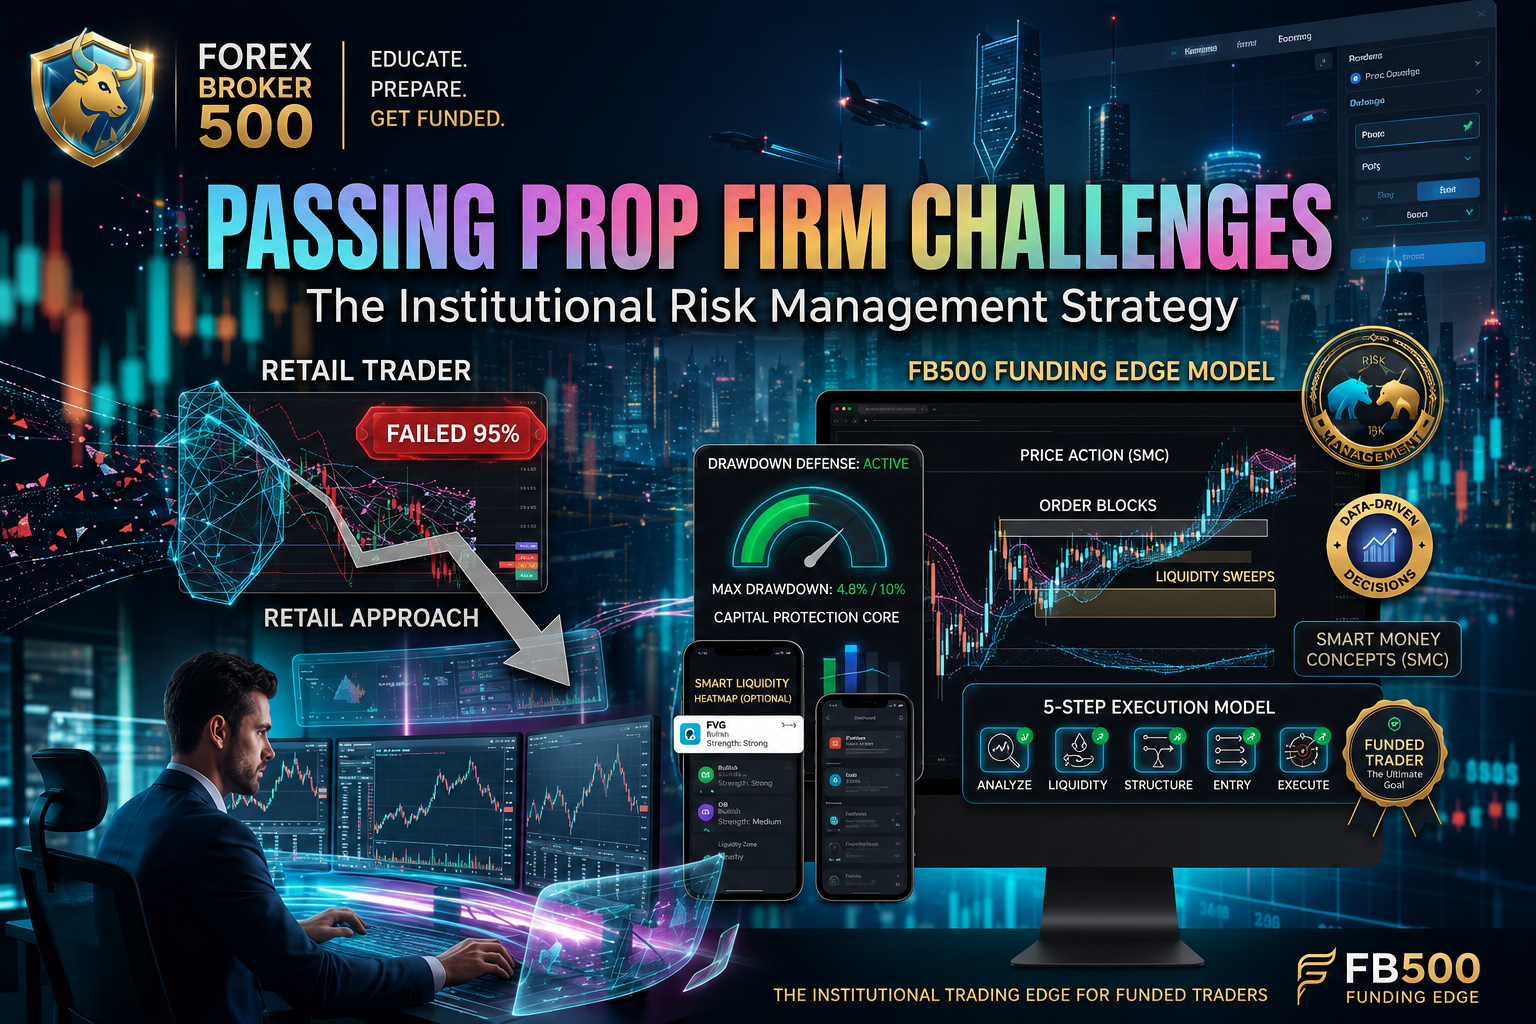
How to Pass Your Prop Firm Challenge: Inside the FB500 Funding Edge Strategy
The brutal reality of the proprietary trading industry is that 95% of traders fail their evaluation challenges. It’s rarely because their technical analysis is inherently[…]
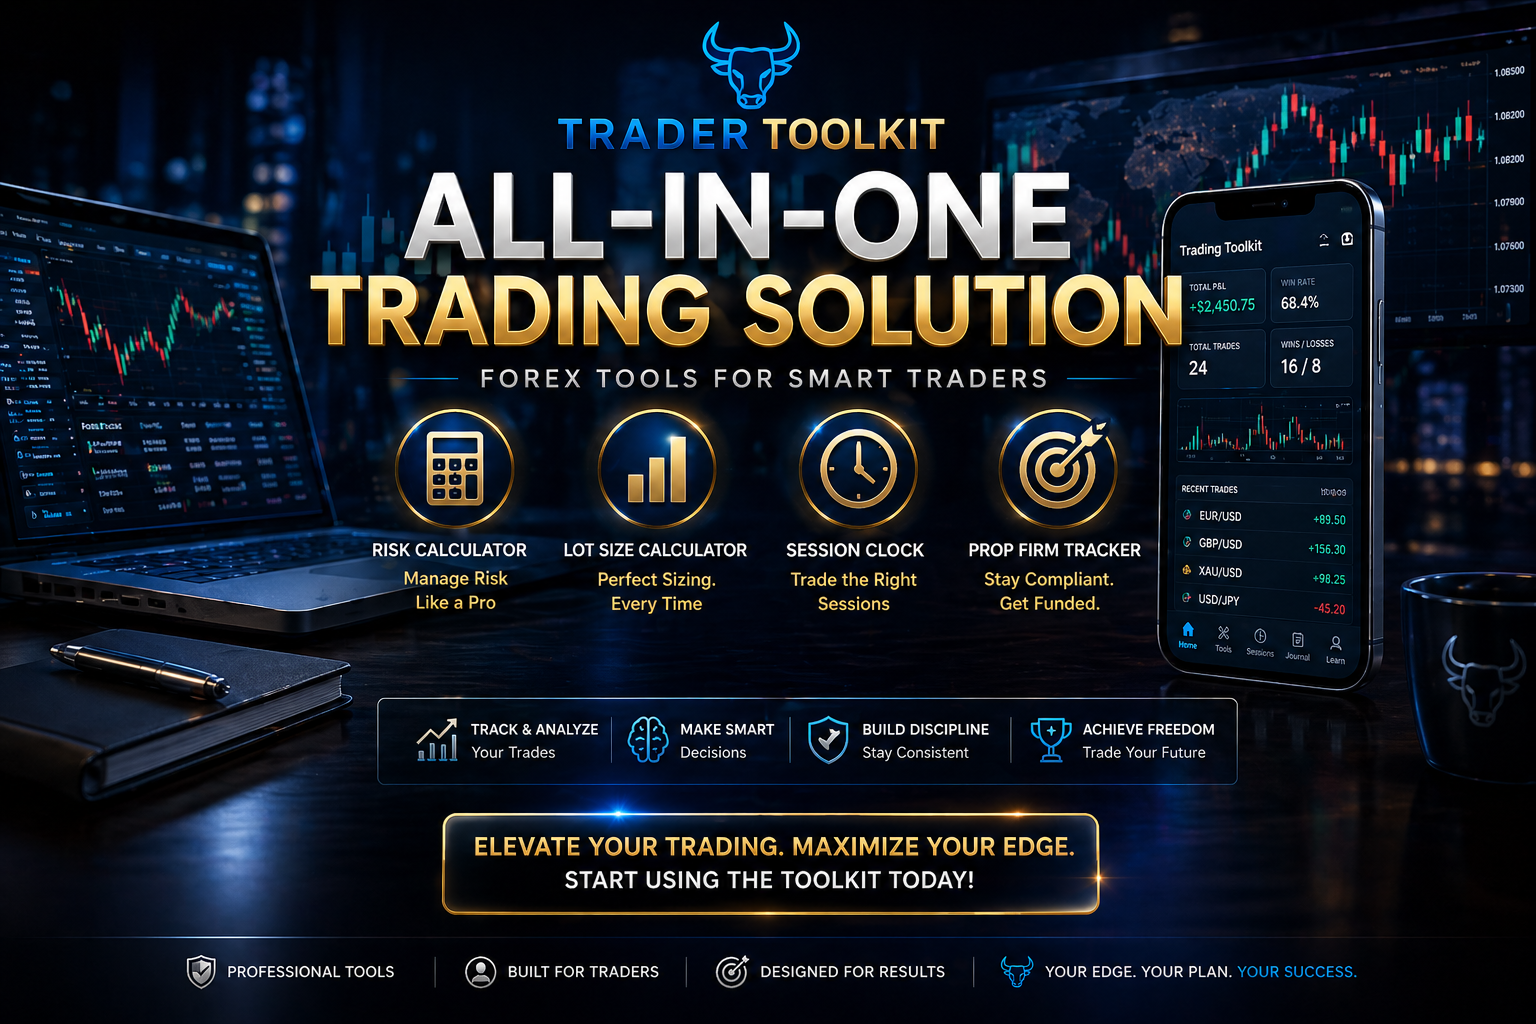
Trader Toolkit: The Free Forex App Every Smart Trader Needs
In today’s fast-moving forex market, having the right tools can be the difference between consistent growth and blowing your account. Most traders focus on strategies…But[…]
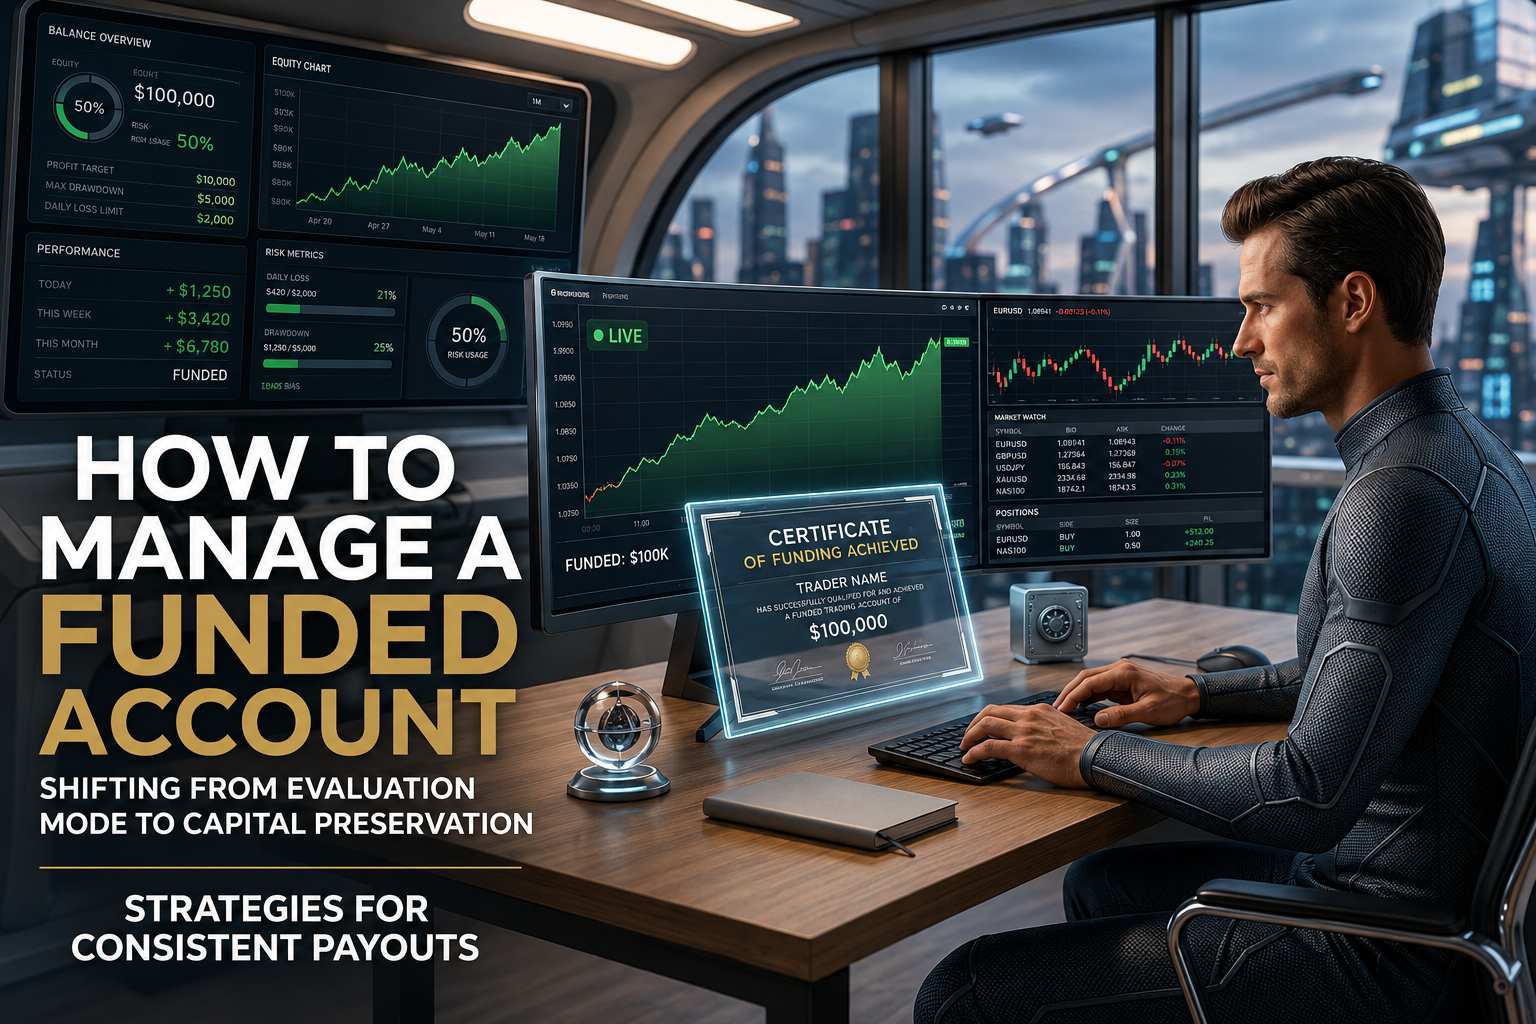
How to Manage a Funded Account: Shifting from Evaluation Mode to Capital Preservation
Passing a prop firm challenge brings a massive dopamine spike. You’ve proven you can hit the profit targets, you’ve navigated the strict drawdown boundaries, and[…]
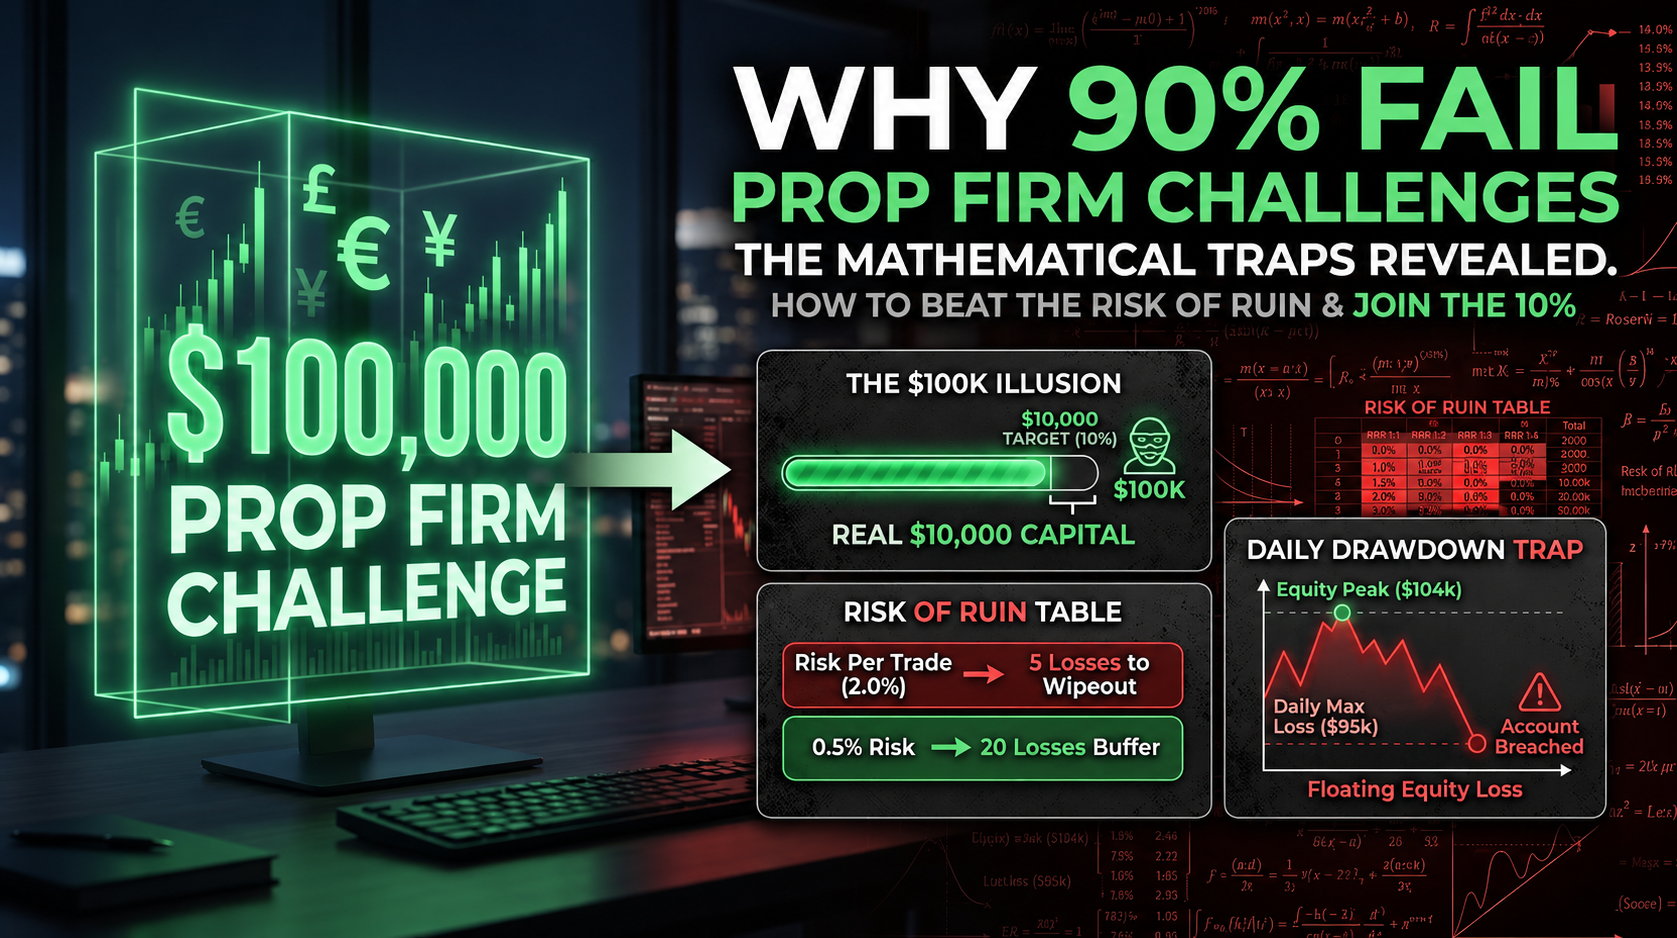
The Math Behind Prop Firm Failure: Why 90% of Traders Lose the Evaluation
Every aspiring funded trader knows the statistic: roughly 90% of people who buy a prop firm challenge fail it. The retail trading world loves to[…]
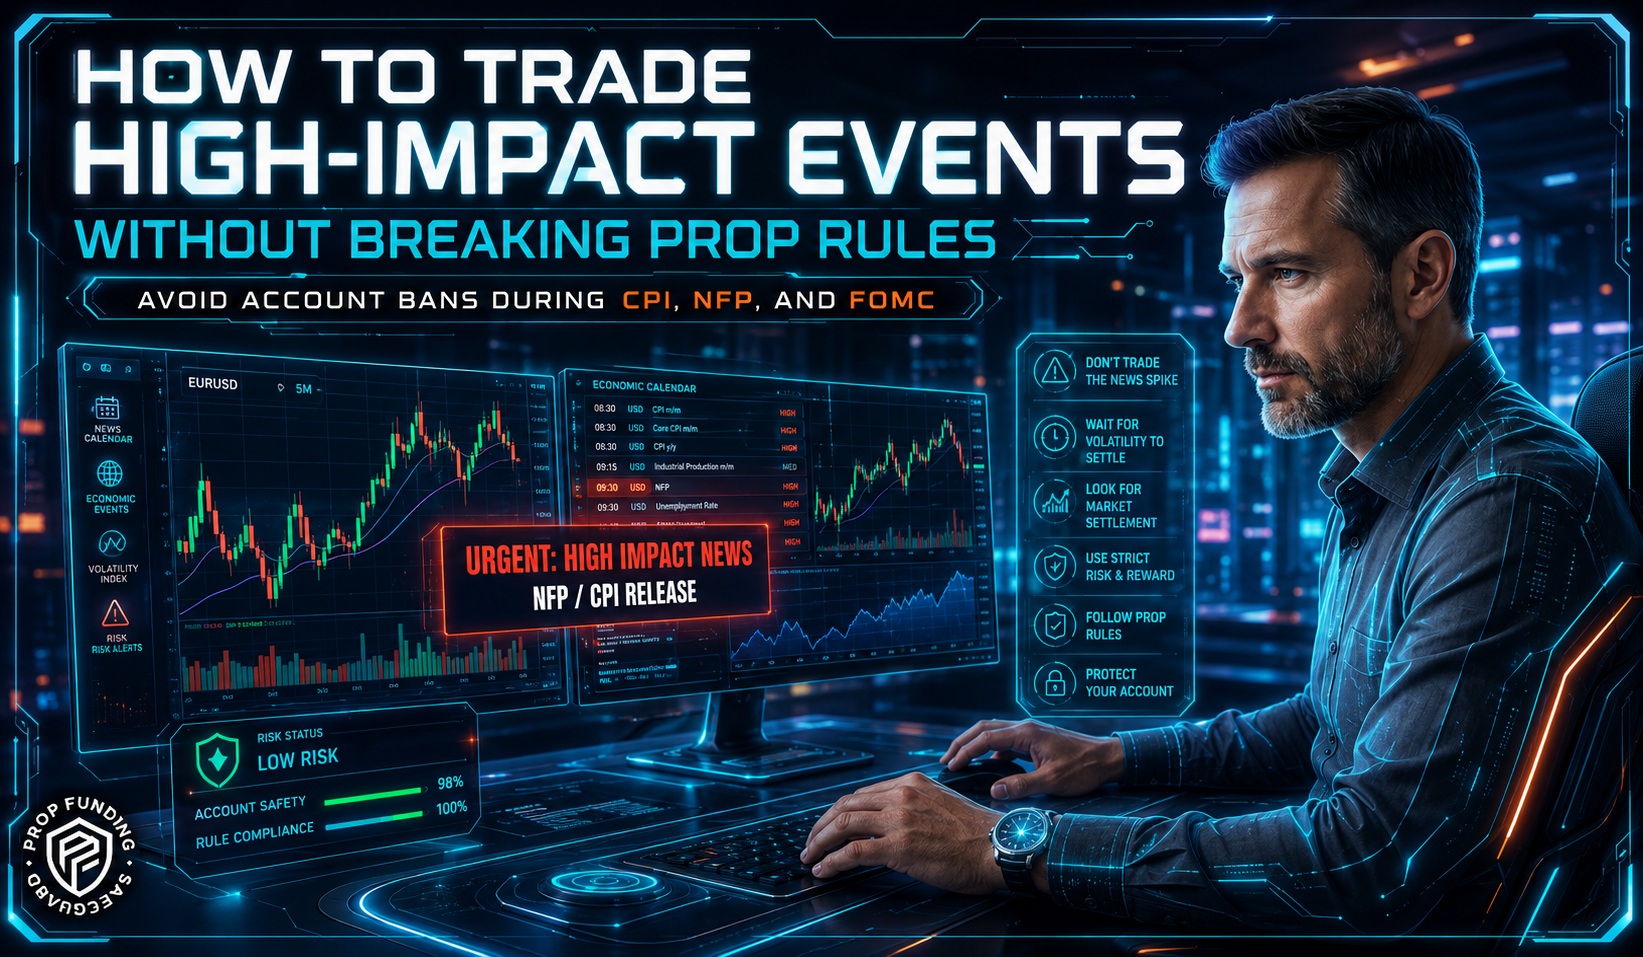
How to Trade High-Impact Events Without Breaking Prop Rules
Passing a prop firm evaluation is an incredible achievement, but keeping the funded account is where the real challenge begins. For many traders, the biggest[…]

How to Spot and Avoid “Forex Lifestyle” Scams in South Africa (2026 Guide)
If you spend any time on Instagram, TikTok, or YouTube in South Africa, your feed has almost certainly served you a variation of the exact[…]
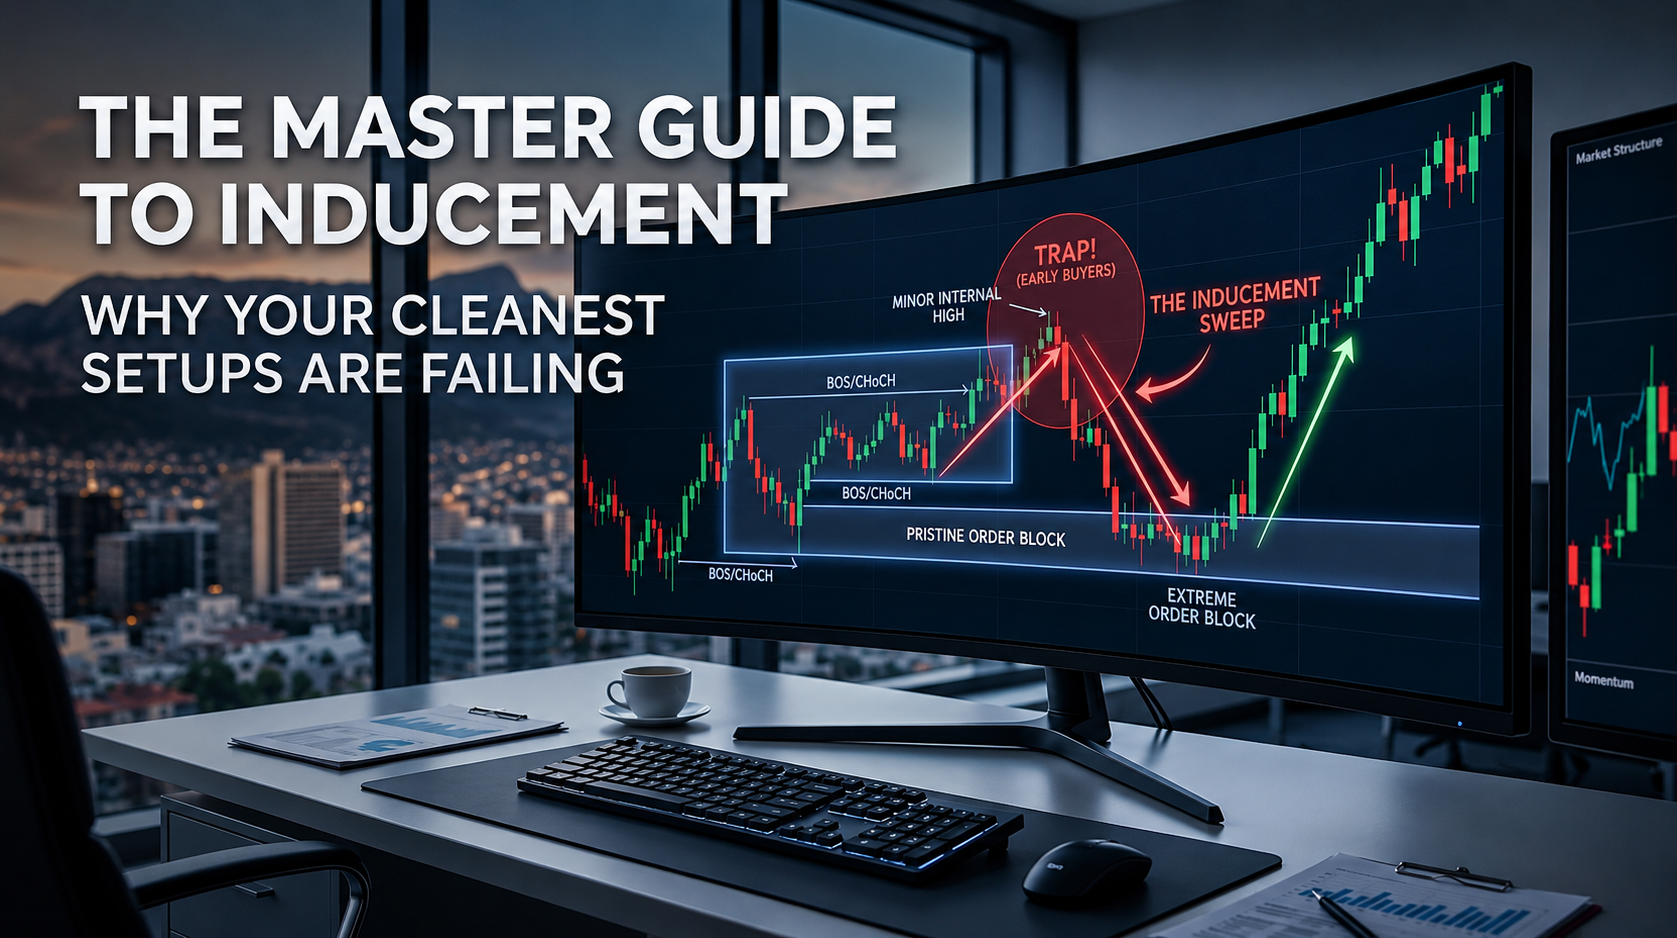
The Master Guide to Inducement: Why Your Cleanest Setups Are Failing
You’ve done everything right. You mapped the market structure perfectly, identified a pristine unmitigated order block, marked out the obvious buy-side liquidity pools, and set[…]
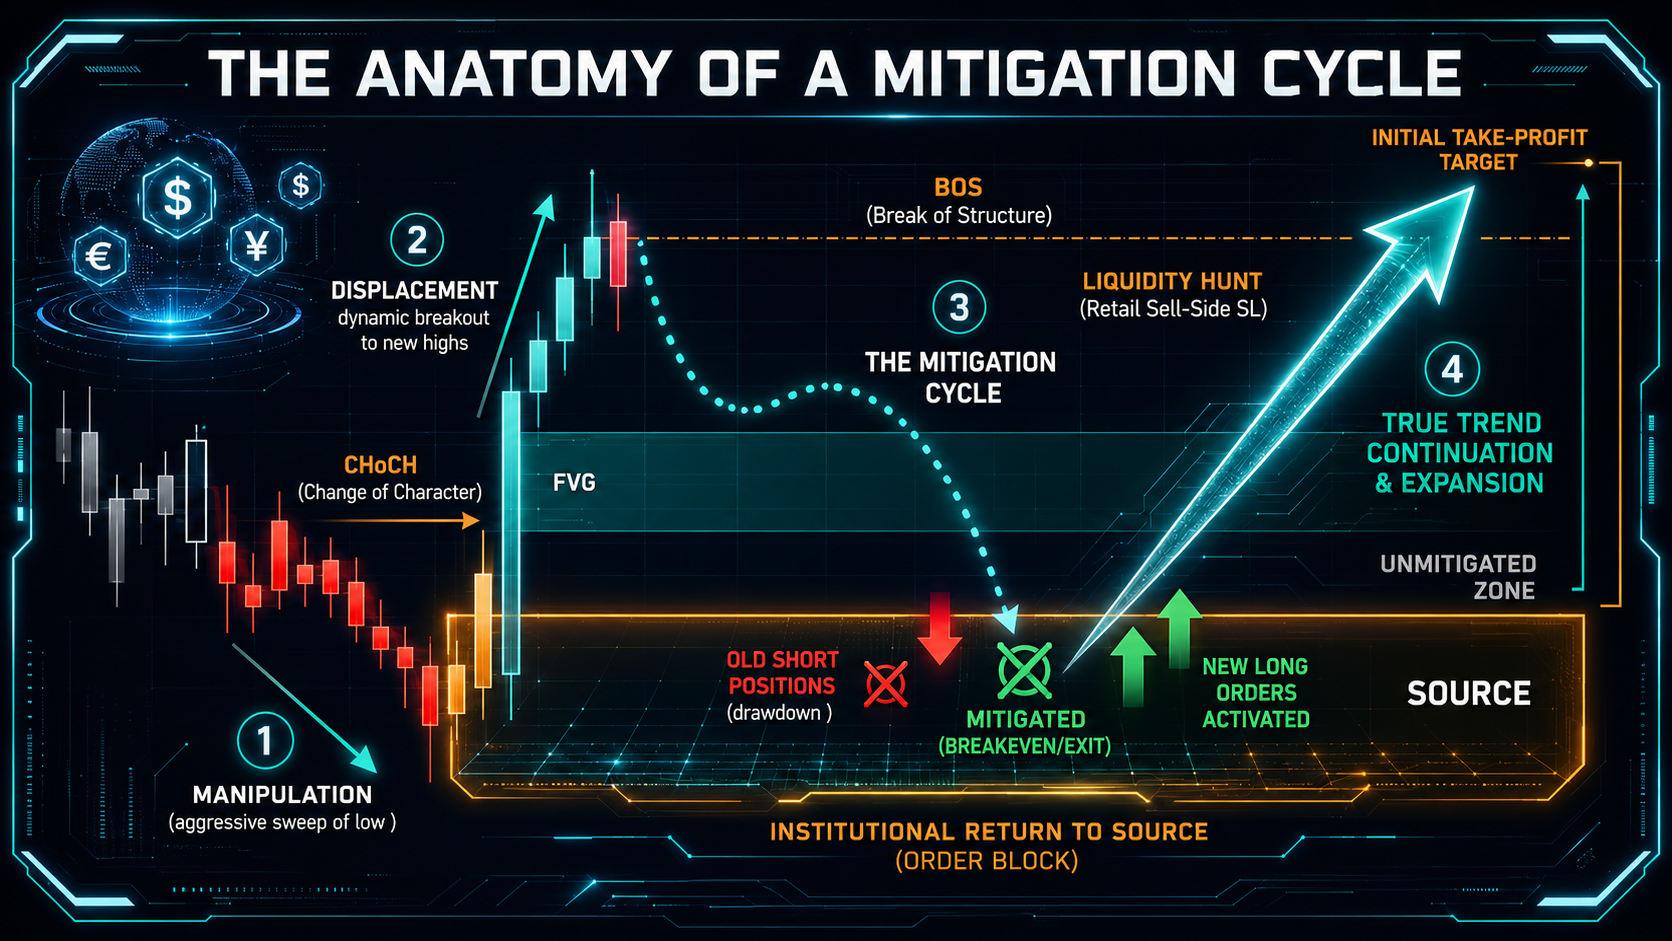
The Anatomy of a Mitigation Cycle: How to Trade the Institutional Return to Source
You’ve perfectly identified a structural shift. You caught the Change of Character ($\text{CHoCH}$), mapped out the high-probability order block, and waited for price to move.[…]
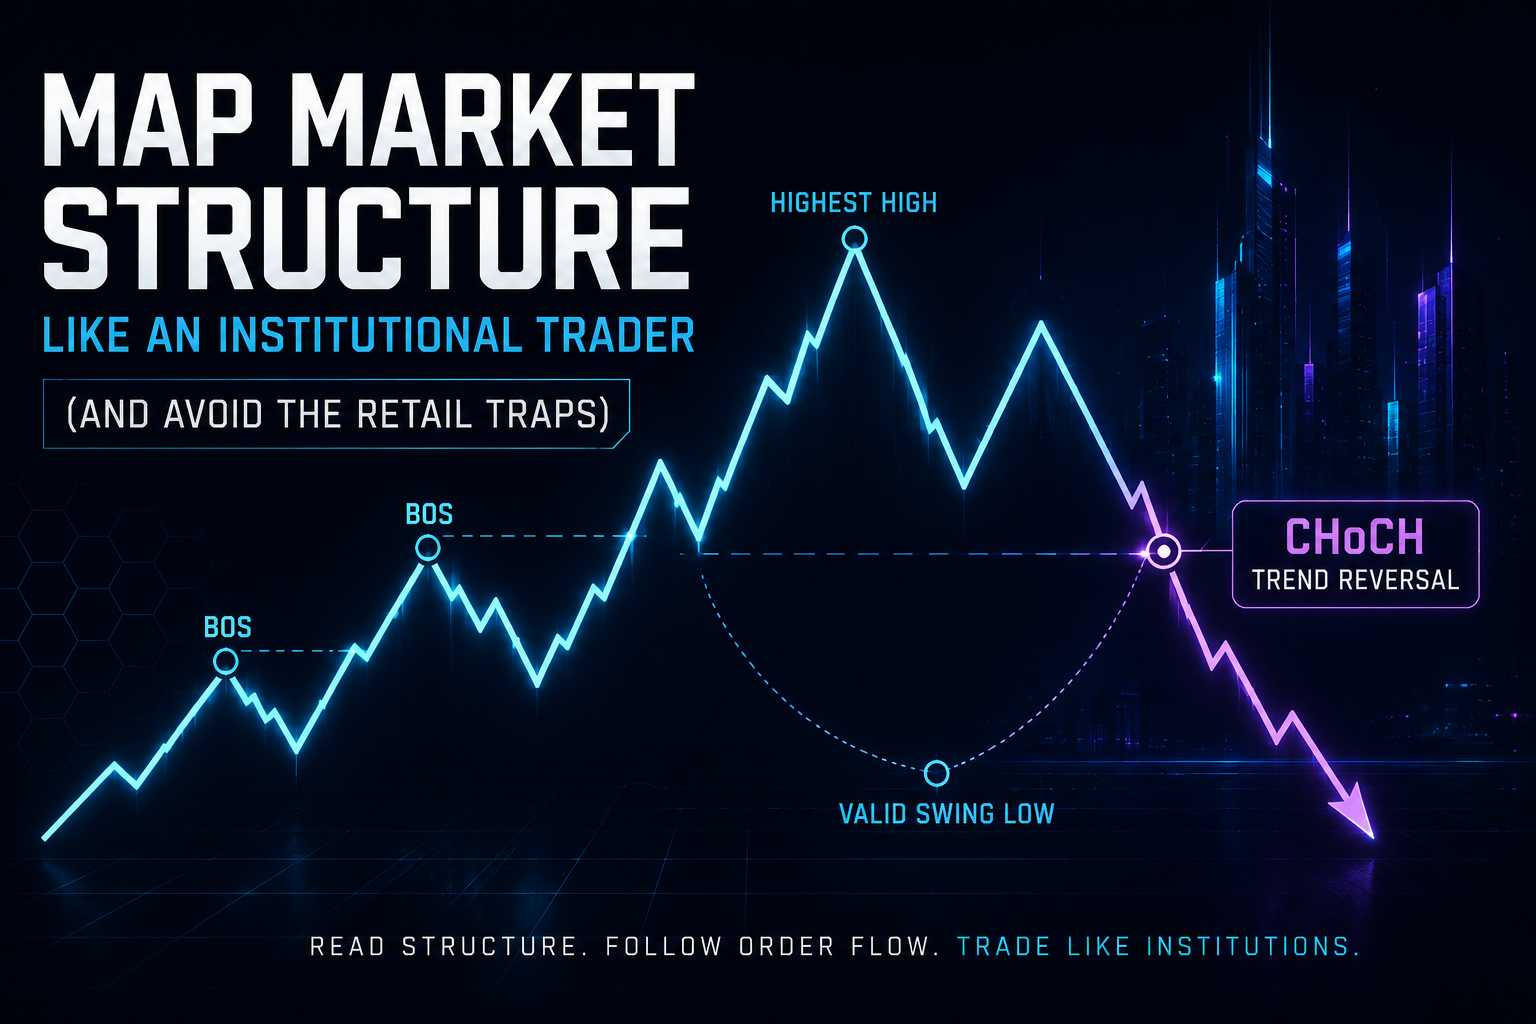
How to Map Market Structure Like an Institutional Trader (and Avoid the Retail Traps)
Every retail trader is taught the exact same formula for identifying a trend: “Look for a series of higher highs and higher lows.” It sounds[…]
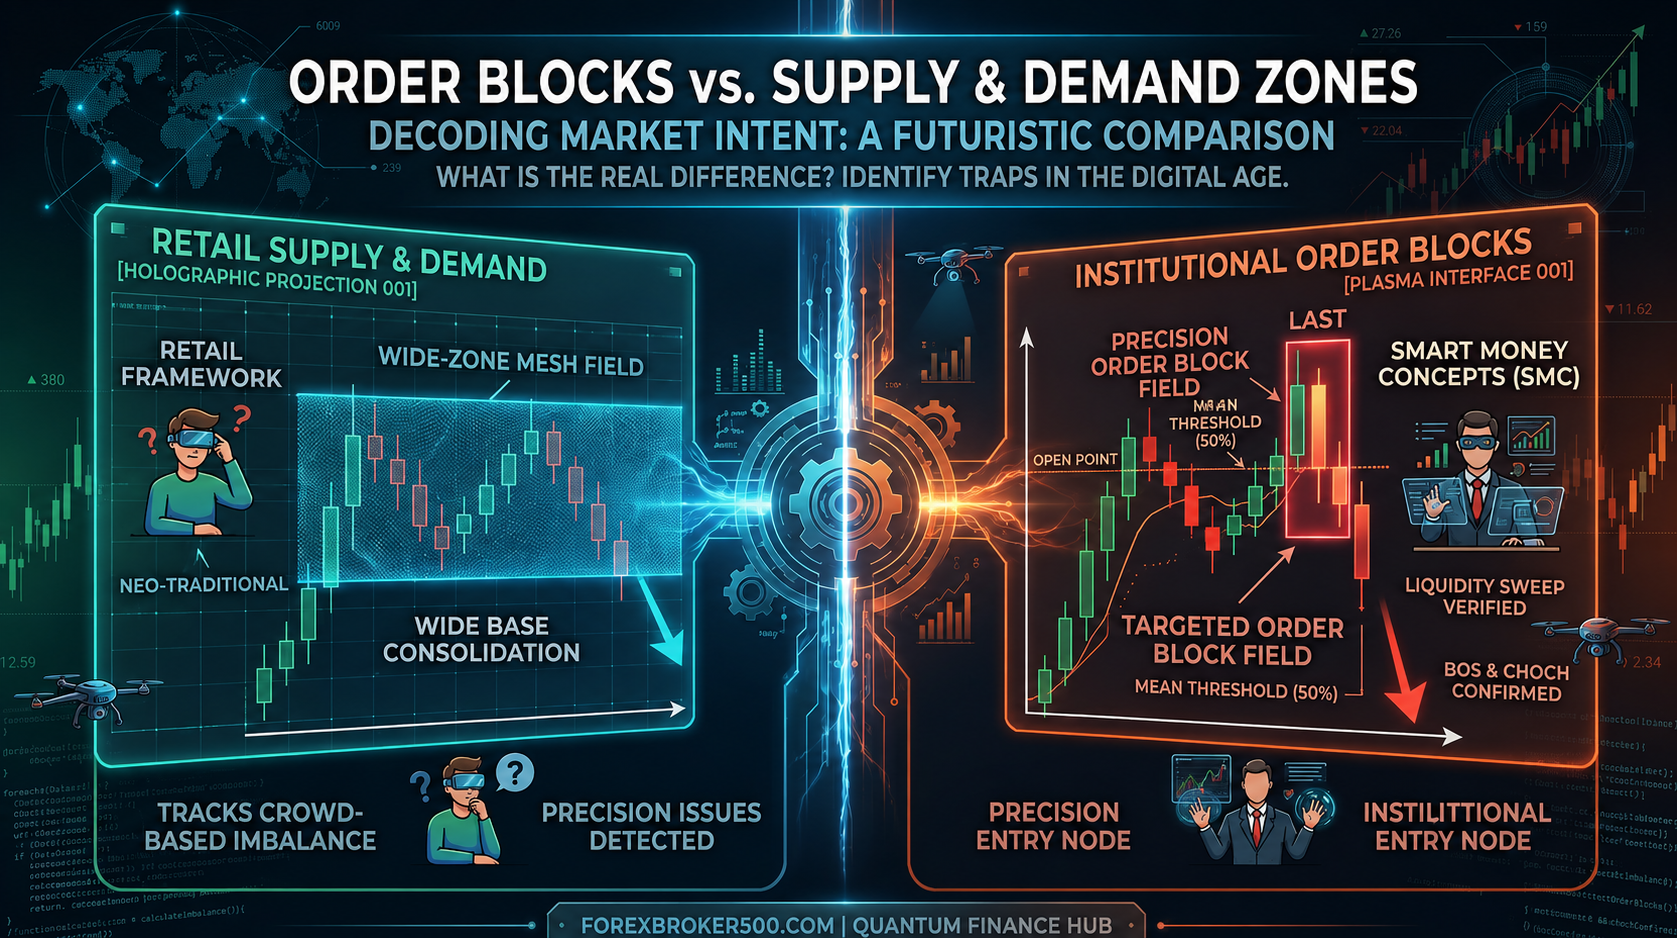
Order Blocks vs. Supply & Demand Zones: What’s the Real Difference?
We have all been there: you open your charts, meticulously mark a beautiful, clean area of consolidation, and wait patiently for price to return. The[…]
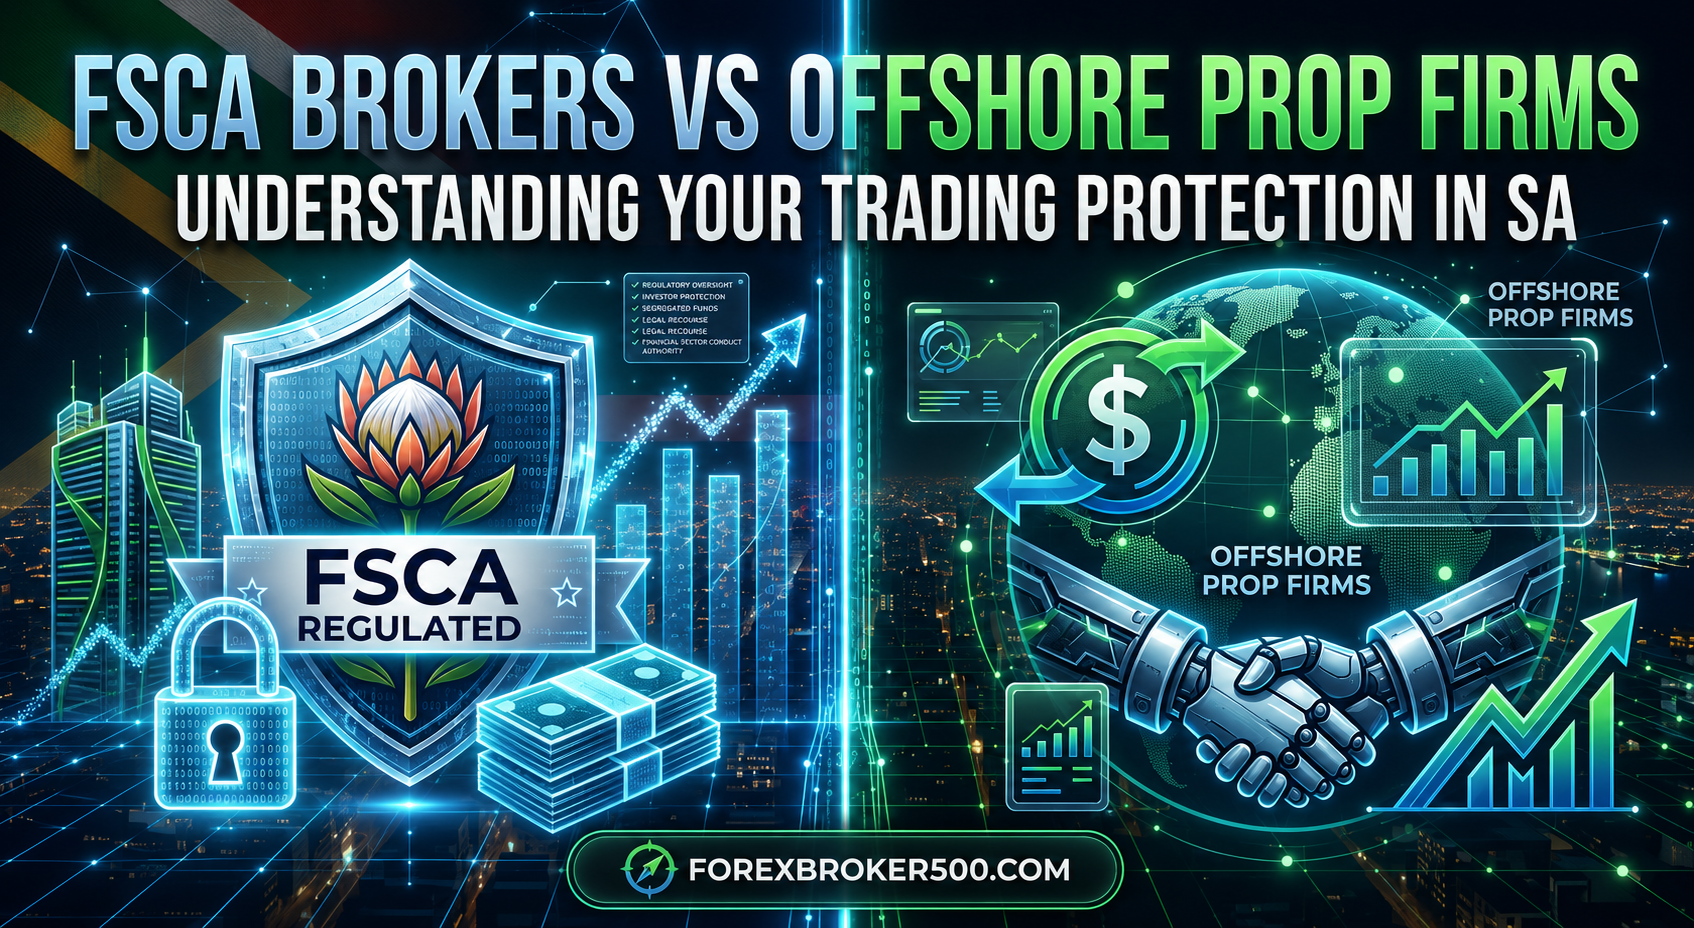
FSCA Brokers vs. Offshore Prop Firms: Where is Your Money Actually Safe in South Africa?
The South African forex landscape is experiencing a massive shift. A few years ago, the ultimate goal for a local trader was simple: save up[…]
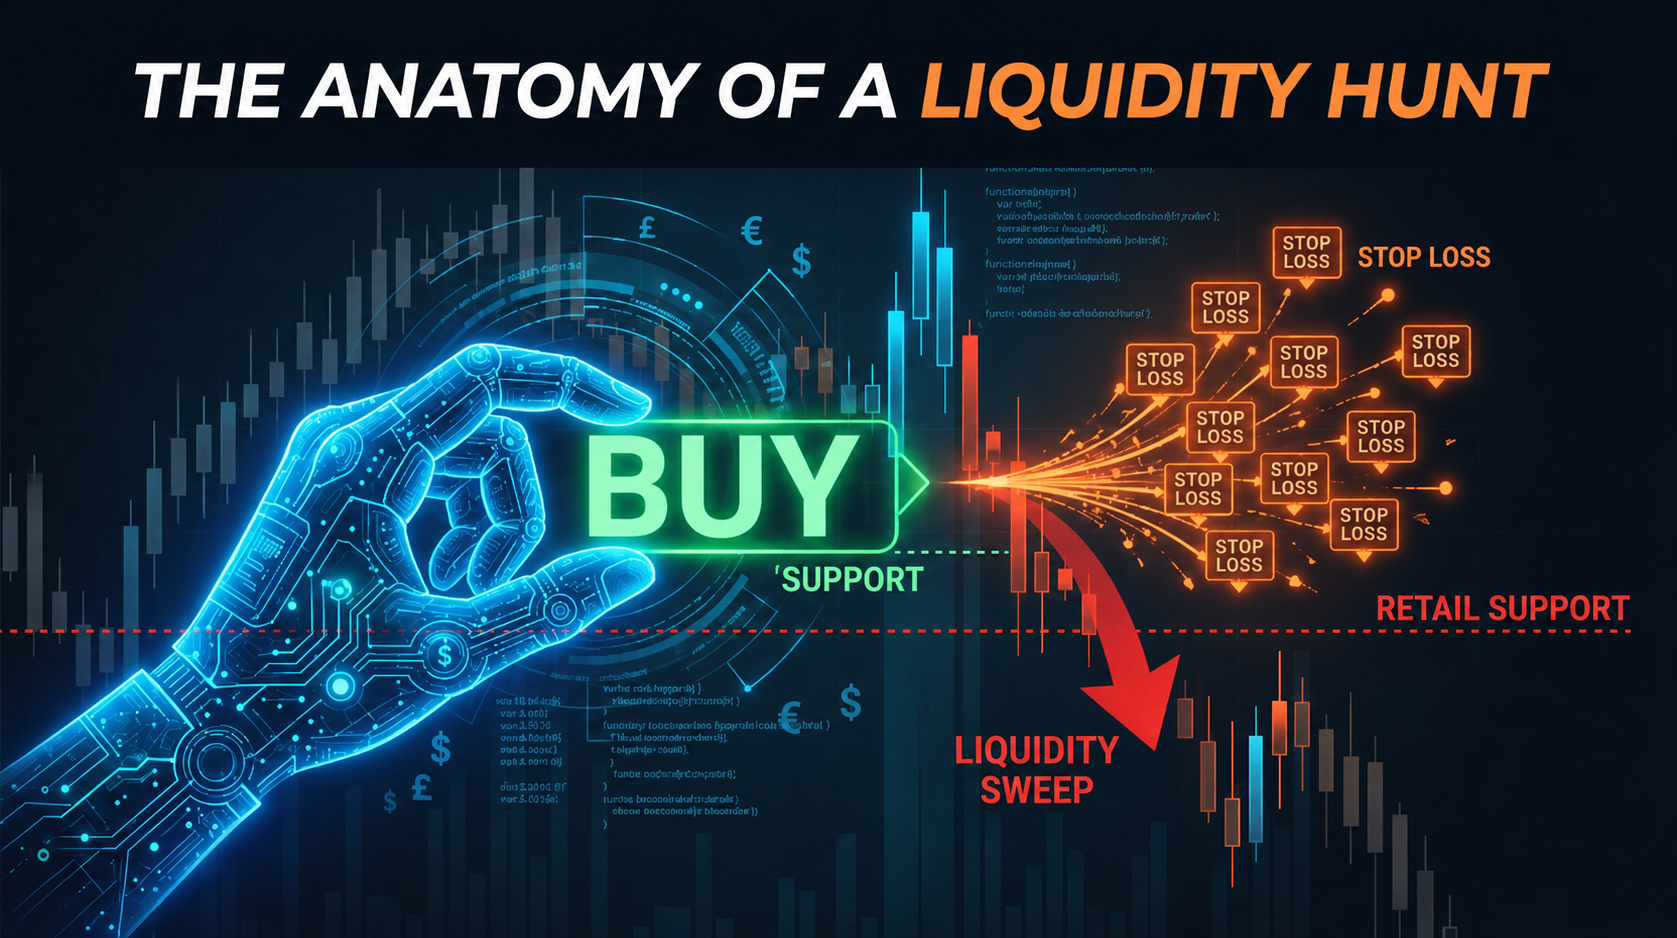
The Anatomy of a Liquidity Hunt: How Big Banks Trigger Retail Stop Losses
If you have ever placed a stop loss right outside a textbook support or resistance level, only to watch the market spike, knock you out,[…]
© 2026 Forex Broker 500. All Rights Reserved.