We have all been there: you open your charts, meticulously mark a beautiful, clean area of consolidation, and wait patiently for price to return. The setup looks textbook. Yet, the moment price hits your zone, it cuts through it like a hot knife through butter, triggering your stop-loss before immediately reversing in your intended direction.
You weren’t necessarily wrong about the market’s direction, but you were trapped by a common misconception: treating traditional Supply & Demand (S&D) zones and institutional Order Blocks (OBs) as the exact same thing.
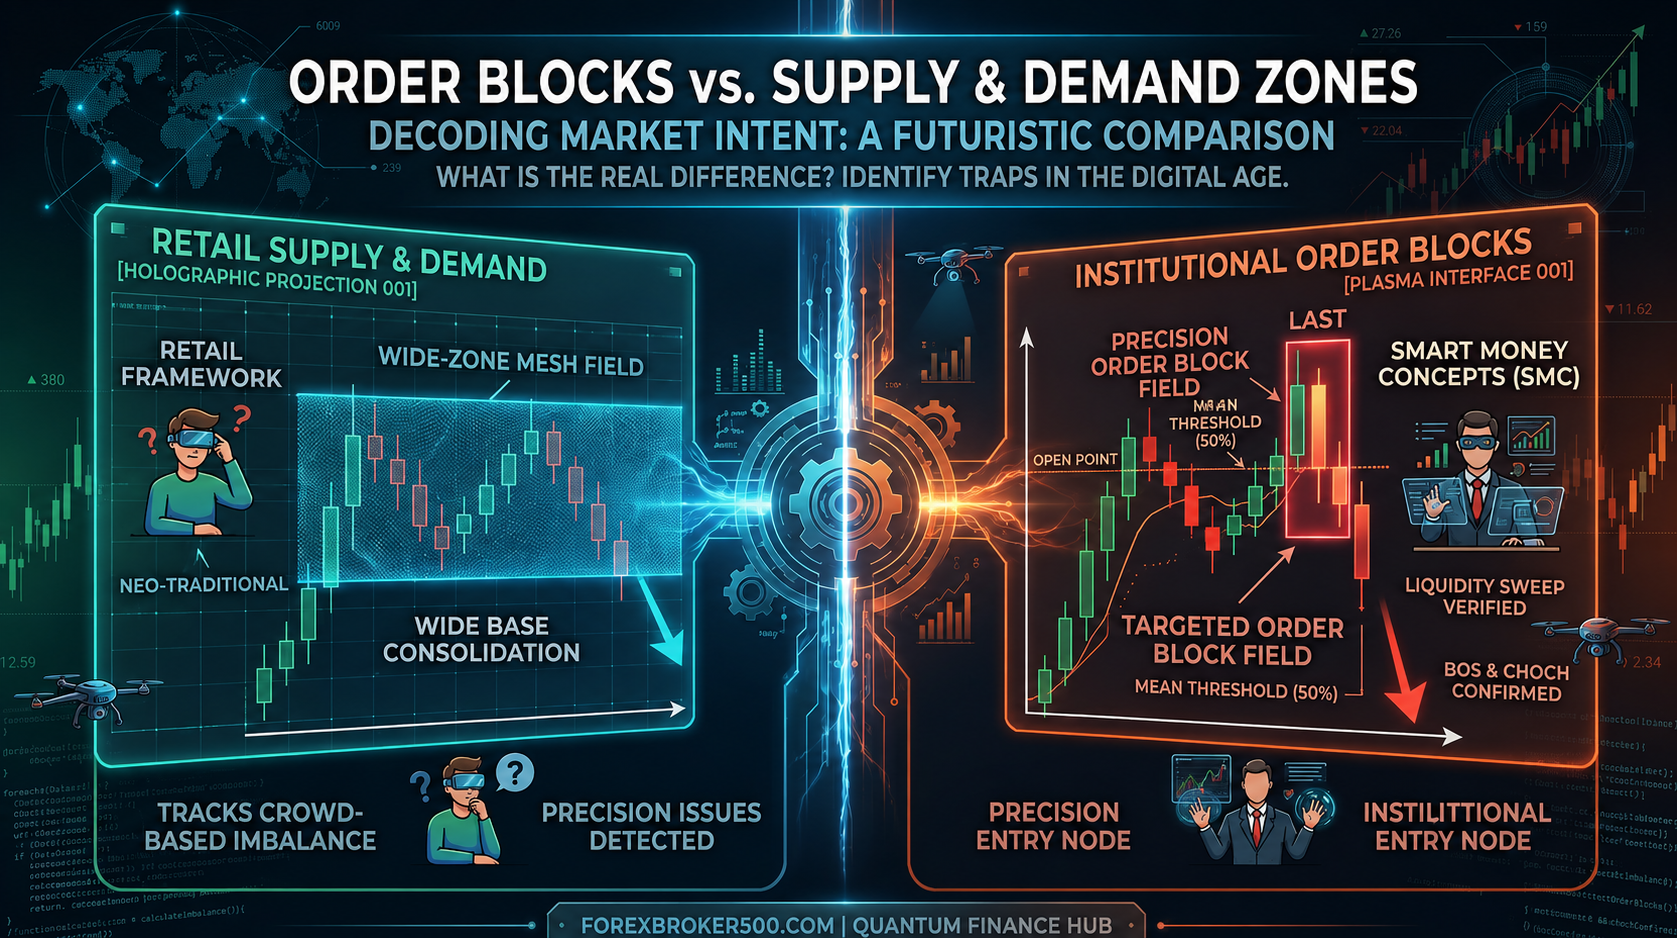
While the retail trading world often uses these terms interchangeably, understanding the mechanical and structural differences between them is what separates struggling retail traders from funded professionals. Let’s break down the core mechanics of both concepts so you can stop acting as market liquidity and start tracking the real footprints of smart money.
Decoding Traditional Supply & Demand (S&D)
To understand the difference, we must first look at the retail framework. Traditional Supply and Demand trading focuses on large areas of market imbalance. These zones represent price levels where a sudden, aggressive influx of buying or selling occurred, leaving behind unfilled limit orders.
The Classic Formations
Retail traders typically map these zones based on two primary structural behaviours:
- Reversal Patterns: Rally-Base-Drop (RBD) for supply zones and Drop-Base-Rally (DBR) for demand zones.
- Continuation Patterns: Rally-Base-Rally (RBR) and Drop-Base-Drop (DBD).

When drawing an S&D zone, a trader marks the entire “base” or consolidation area before the explosive expansion. Because these zones encompass a whole cluster of candles, they tend to be visually wide, giving you a general neighbourhood of where the market might react, rather than a precise level.
Decoding Institutional Order Blocks (OBs)
An Order Block is a completely different beast. It is not just an area of rapid price movement; it is a specific, engineered footprint left behind by central banks and large institutional players managing massive order flow.
Because institutions cannot simply execute a 10,000-lot order without causing massive slippage, they must build a position by manipulating price into areas of existing liquidity.
The Core Mechanics
An order block is defined as the last opposing candle before a sharp, impulsive expansion that actively alters market structure.
- Bullish Order Block: The final down-candle (sell to buy) that sweeps sell-side liquidity before a massive displacement upward.
- Bearish Order Block: The final up-candle (buy to sell) that sweeps buy-side liquidity before a sharp drive downward.
The Invalidation Rule
Unlike a retail supply zone, a valid institutional order block carries a strict structural rule: it must result in a Break of Structure (BOS) or a Change of Character (CHoCH) to prove institutional intent. If price simply moves away from a zone without breaking structure, it is a retail trap—not an order block.

The Head-to-Head Showdown: Key Differences
If you want to transition from a retail mindset into true Smart Money Concepts (SMC), you need to contrast these frameworks side-by-side:
| Feature | Traditional Supply & Demand Zones | Institutional Order Blocks (OB) |
| Market Origin | General retail/algorithmic buying & selling imbalance. | Targeted central bank and institutional position building. |
| Prerequisites | A strong, visual departure from a base (Imbalance). | A deliberate Liquidity Sweep followed by a BOS/CHoCH. |
| Zone Refinement | Wide areas tracking the entire consolidation base. | Ultra-refined level tracking only the last opposing candle. |
| Invalidation | A basic candle closes outside the drawn base boundaries. | A clear violation of the Mean Threshold (the 50% equilibrium mark of the OB). |
Volume vs. Intent
Traditional S&D looks purely at the volume of the move away from a zone. Order blocks focus entirely on the intent behind the move. An order block tracks where the smart money deliberately sponsored a liquidity hunt to mitigate their own positions before driving the trend.
Execution Blueprint: How to Trade Valid Order Blocks
To stop guessing and start executing with precision, follow this four-step institutional checklist:
Step 1: Confirm the Liquidity Sweep
Never draw an order block on a clean chart pattern. Look for price to aggressively run past a major historical high or low (retail support/resistance) to hunt stop-losses first.
Step 2: Identify the Displacement
Once liquidity is cleared, watch for an explosive move in the opposite direction. This displacement must leave behind a Fair Value Gap (FVG) or an explicit market imbalance, signalling that retail traders were completely left behind.
Step 3: Refine Your Entry Box
Instead of highlighting a massive 40-pip retail demand zone, isolate the single last opposing candle. To achieve an ultra-tight risk-to-reward ratio, set your limit orders either at the open of that candle or directly at its Mean Threshold (50% level).
Step 4: Wait for Mitigation
Allow price to organically trace back into your refined box. This return to the source is called mitigation—the process where big players close out their remaining losing drawdown positions at breakeven before continuing the true structural trend.
[Liquidity Sweep] ➔ [Displacement + BOS] ➔ [Refine to 50% of OB] ➔ [Mitigation Entry]
Why Even High-Probability Zones Fail
If your order blocks are still getting smashed, you are likely falling victim to two classic errors:
- Over-Mapping the Chart: Marking every single up-and-down candle on a 5-minute chart. High-probability order blocks require a higher-timeframe context (1-hour, 4-hour, or Daily) to carry true institutional weight.
- Trading Counter-Trend: Attempting to buy a bullish order block while the overall daily institutional order flow is aggressively bearish.
Take Your Funding Edge to the Next Level
Understanding where big banks position their capital is the first step toward true market mastery. If you are tired of getting stopped out by a few pips inside wide retail zones, it is time to build a structured execution plan.
To bridge the gap between understanding institutional mechanics and actually passing capital evaluations, explore the full framework inside the FB500 Funding Edge Strategy. Built specifically to navigate strict drawdown limits and clear prop evaluations, it gives you the exact rules needed to trade alongside smart money.
For more institutional insights, strategy updates, and professional broker breakdowns, keep up with the core hub at Forex Broker 500.
What’s Your Take?
Are you still relying on traditional retail supply and demand bases, or have you shifted your charts entirely to institutional order blocks? Let us know your experience in the comments below!
No responses yet