
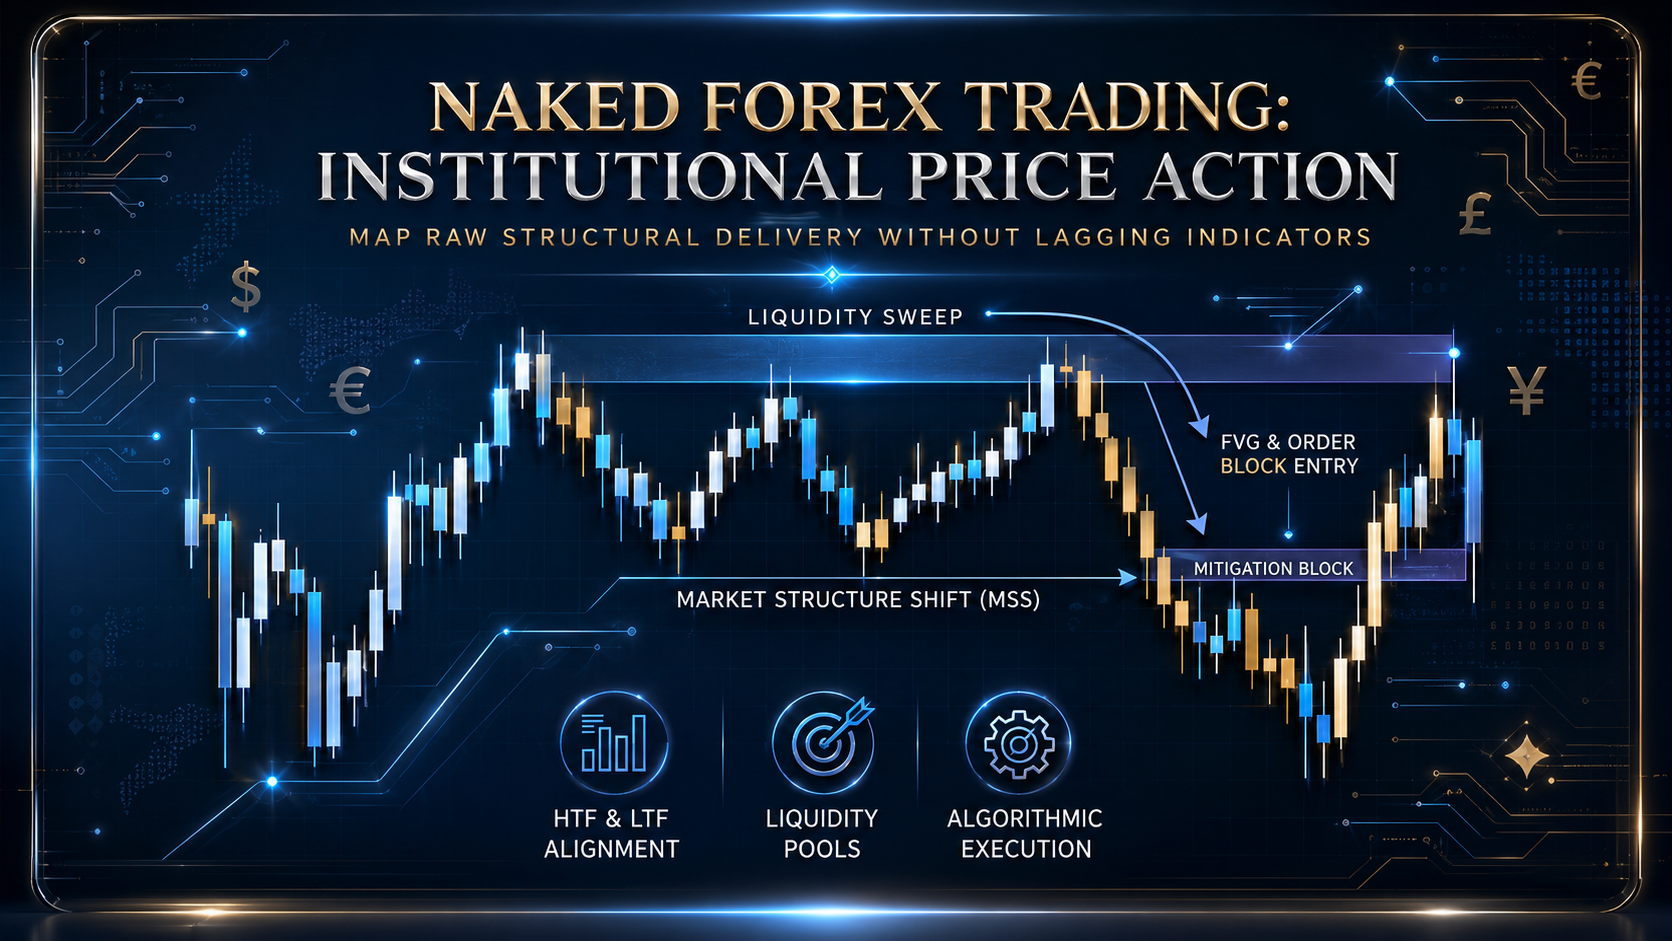
Most retail traders treat naked forex trading as looking for simple candlesticks like pin bars or engulfing patterns at basic support and resistance lines. The harsh reality? Institutional algorithms do not care about retail trendlines. They operate on liquidity pools and structural delivery.
To trade truly “naked” is to ignore lagging indicators (like MACD or RSI) and instead track exactly how smart money moves capital across structural price legs. If you still want access to premium technical software as a baseline reference, you can secure our Top 20 Indicators Free Download to compare lagging tools side-by-side with raw price delivery.
1. Structural Framework: HTF vs. LTF Alignment
Institutions see the market as a series of premium and discount pricing arrays within higher time frame (HTF) ranges. To map a naked chart accurately, you must identify whether the market is in a phase of Expansion, Retracement, Reaccumulation/Redistribution, or Reversal.
- Premium Pricing: Any price point located in the top 50% of a defined trading range. Institutional algorithms look to sell or distribute here.
- Discount Pricing: Any price point located in the bottom 50% of a defined trading range. Institutional algorithms look to buy or accumulate here.
Always map your structural break from the higher time frame down to your execution frame. If the daily chart is bearish, executing a retail “bullish double bottom” on a 5-minute chart is low-probability because you are buying directly into an institutional premium.
2. The Four Pillars of Naked Institutional Mapping
To trade without indicators, your eyes must be trained to recognise how price actively seeks out pools of resting orders before shifting direction.

1. Identify Liquidity Pools (The Market Engine):
Locate where retail stop-losses sit. These typically cluster above equal highs (Buy-side Liquidity or BSL) and below equal lows (Sell-side Liquidity or SSL). Algorithms actively drive price toward these areas to absorb orders.
2. Spot the Liquidity Sweep & Displacement:
Watch for price to breach a liquidity pool and immediately reject. This is an institutional grab. Look for a powerful, aggressive move in the opposite direction (displacement), leaving a clear expansion candle.
3. Mark the Market Structure Shift (MSS):
An aggressive displacement candle body must close past the most recent swing high or low that created the liquidity grab. This confirms that the short-term order flow has changed hands from retail buyers to institutional sellers.
4. Frame Entry inside the Mitigation Zone:
Once structure shifts, look for price to return to the last up/down candle before the expansion (the Order Block) or an unmitigated Fair Value Gap (FVG). This is your precise naked chart entry point.
3. Retail Mechanics vs. Institutional Realities
When you clean your charts of retail tools, your understanding of price shifts completely.
| Retail Trend Trading | Pure Institutional Price Action |
| Enters on a third touch of a visible trendline. | Anticipates the trendline breaking to sweep liquidity sitting directly behind it. |
| Waits for oversold signals on indicators like RSI or Stochastics. | Buys exclusively when price drops deep into a HTF discount array. |
| Focuses heavily on specific isolated candlestick patterns. | Focuses entirely on candle context, volume of displacement, and delivery structure. |
Institutional Axiom: Volume does not lie, but it hides in plain sight. If a candle breaks a key level with a tiny body and long wicks, it is likely a liquidity sweep, not a true breakout. True institutional delivery leaves massive, clean candle bodies that close near their extremes.
4. Setting Up Your Clean Workspace
Trading a naked chart means removing anything that delays your reaction time.
- Strip the Moving Averages: They tell you where price was, not where the liquidity rests now.
- Focus on Structural Swing Points: Mark your daily and weekly highs/lows. These are the most critical liquidity boundaries on your chart.
- Track Time and Price (Killzones): High-probability institutional expansion occurs almost exclusively during specific windows: the London Open (02:00–05:00 EST) and the New York Open (07:00–10:00 EST). Outside of these killzones, naked price action often devolves into noisy retail consolidation.
Unlock Underwritten Institutional Funding
Reading raw structure perfectly is only half the battle; surviving the market requires deep capital reserves. If you have mastered the art of clean, naked chart mapping and want to stop risking your personal capital, let us fund your strategy.
Head over to the ForexBroker500 Homepage to apply for institutional prop funding, pass our evaluation metrics, and gain access to scaled balances backed directly by institutional liquidity providers.

No responses yet