
If you are still looking at your forex charts believing that price moves because a sudden wave of retail buyers or sellers rushed into the market, you are playing a game that doesn’t exist. Retail orders do not move global currency markets.
The reality behind modern price action is entirely mechanical. Prices are delivered by a highly sophisticated, centralized automation script known as the Interbank Price Delivery Algorithm (IPDA).
Understanding this algorithm is the definitive dividing line between struggling retail chartists and professional Smart Money Concepts (SMC) traders. The market is not chaotic, nor is it random—it is a scripted data delivery network. Here is exactly how it operates.
What is the Interbank Price Delivery Algorithm?
The Interbank Price Delivery Algorithm is the automated engine utilized by central banks and major tier-1 liquidity providers to deliver prices across currency pairs, indices, and commodities.
Unlike traditional retail theories that preach dynamic supply and demand, IPDA operates on strict programming logic. The algorithm doesn’t care about your moving average crossovers or trendlines. It has two specific, non-negotiable operational objectives every single day:
- To seek out and capture resting liquidity pools.
- To efficiently rebalance market inefficiencies (imbalances).
Instead of reacting to trading volume dynamically, the algorithm systematically guides price from one pool of liquidity to an open price imbalance, and back again.
The Operational Matrix: The 20, 40, and 60-Day Look-Back Ranges
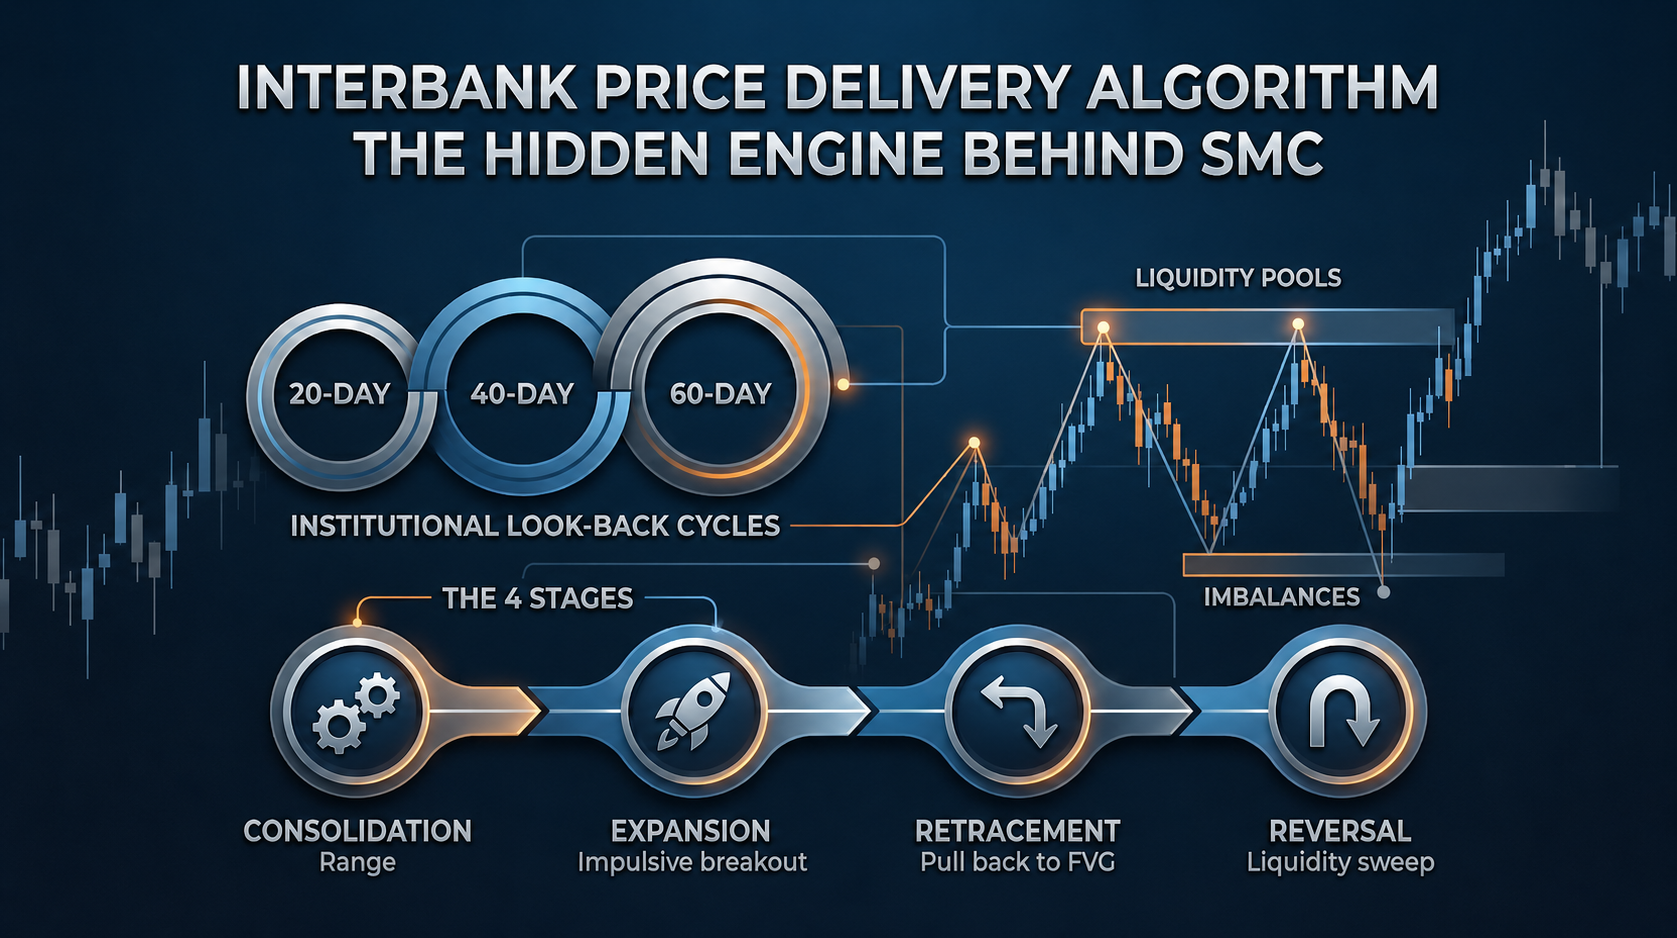
To project where the algorithm is going to draw price next, you have to understand how it views time. IPDA doesn’t look at an infinite history; it operates within strict data ranges on the Daily chart. Starting from the current trading day, the algorithm looks back across three consecutive 20-day institutional windows:
- The 20-Day Range: The immediate look-back window. It highlights short-term liquidity pools and current dealing ranges.
- The 40-Day Range: The medium-term window. It reveals historical swing points where larger blocks of rest orders reside.
- The 60-Day Range: The long-term institutional boundary. This forms the outer edges of the current structural cycle.
Within these look-back periods, the algorithm identifies the absolute highest highs and lowest lows. Because uninformed retail participants stack their stop-loss orders directly above and below these obvious turning points, these specific levels become major targets—known as the Draw on Liquidity.
The 4 Stages of the IPDA Delivery Cycle
The algorithm delivers price through four distinct phases, repeating the sequence across all asset classes to trap retail volume and rebalance institutional books.
[Consolidation] ──> [Expansion] ──> [Retracement] ──> [Reversal]
1. Consolidation
This is where the algorithm restrains price within a tight, predictable range. The sole purpose of consolidation is to induce retail traders into placing buy stops above the range and sell stops below it, effectively engineering the liquidity the central banks require.
2. Expansion
A violent, rapid drive away from the consolidation zone. This indicates that the algorithm has rapidly pushed price to reprice the asset, creating an aggressive footprint that leaves behind structural breaks.
3. Retracement
After an expansion, the algorithm purposely brings price back into the recently created leg. It does this to rebalance the price action, mitigating open orders inside Fair Value Gaps (FVGs) before continuing its true primary directional drive.
4. Reversal
When price aggressively hits a major 20, 40, or 60-day historical liquidity pool, the algorithm engineers a sudden shift in direction. This manifests as a sharp stop-hunt or “turtle soup” pattern before accelerating hard the other way.
The Step-by-Step IPDA Mapping Framework
To trade in complete alignment with institutional delivery, you must stop guessing direction and start mapping the algorithm’s active boundaries every morning.

1.Establish Your Daily Bias.
Open the Daily or Weekly chart. Determine whether the market is currently expanding toward an open institutional imbalance (FVG) or drawing toward an un-swept pool of external liquidity.
2.Plot the Institutional Reference Levels
Count back exactly 20, 40, and 60 trading days on your daily chart. Mark the absolute highest high and lowest low within those windows. These are your major structural targets.
3.Identify the Premium/Discount Equilibrium
Pull a Fibonacci tool across your active trading range. Mark the exact 50% equilibrium line. Never execute a buy order in the Premium zone (above 50%) or a sell order in the Discount zone (below 50%).
4.Wait for the Intraday Liquidity Raid:Step 4.
Drop down to your lower timeframe execution charts (like the 5-minute or 15-minute chart) during specific algorithmic volatility windows (Killzones). Wait for price to aggressively sweep one of your pre-marked daily levels, look for a sharp Market Structure Shift (MSS), and enter on the subsequent mitigation.
The Professional Reality: The Interbank Price Delivery Algorithm doesn’t know your personal account size, and it doesn’t target individual retail accounts. It simply targets mass order concentrations. By shifting your approach from traditional retail chart patterns to mechanical data look-back windows, you stop becoming the liquidity and start trading alongside the machine that delivers it.
Put the Algorithm into Practice: The FB500 Funding Edge Strategy
Understanding the Interbank Price Delivery Algorithm (IPDA) is the foundation of institutional trading, but theory alone won’t pass a funding challenge. To secure capital, you must transform these look-back ranges and delivery cycles into a rigid execution blueprint.
We have codified the exact mechanical footprint of IPDA—including premium/discount filters, daily look-back cycles, and institutional mitigation models—into a single, battle-tested system: The FB500 Funding Edge Strategy.
Stop trading against the machine. By mastering how the algorithm delivers price, you can systematically clear rules, eliminate emotional guesswork, and secure institutional-grade backing. If you are ready to stop being the liquidity and start trading like the banks, explore our institutional resources and prop frameworks directly at Forex Broker 500.

No responses yet