Every retail trader is taught the exact same formula for identifying a trend: “Look for a series of higher highs and higher lows.”
It sounds simple on paper. But when you switch to a live chart, reality hits. You spot what looks like a clean breakout, you buy the higher high, and within minutes, the market aggressively reverses, stops you out, and then immediately flies in your predicted direction.
You didn’t get unlucky. You got caught in a liquidity hunt.
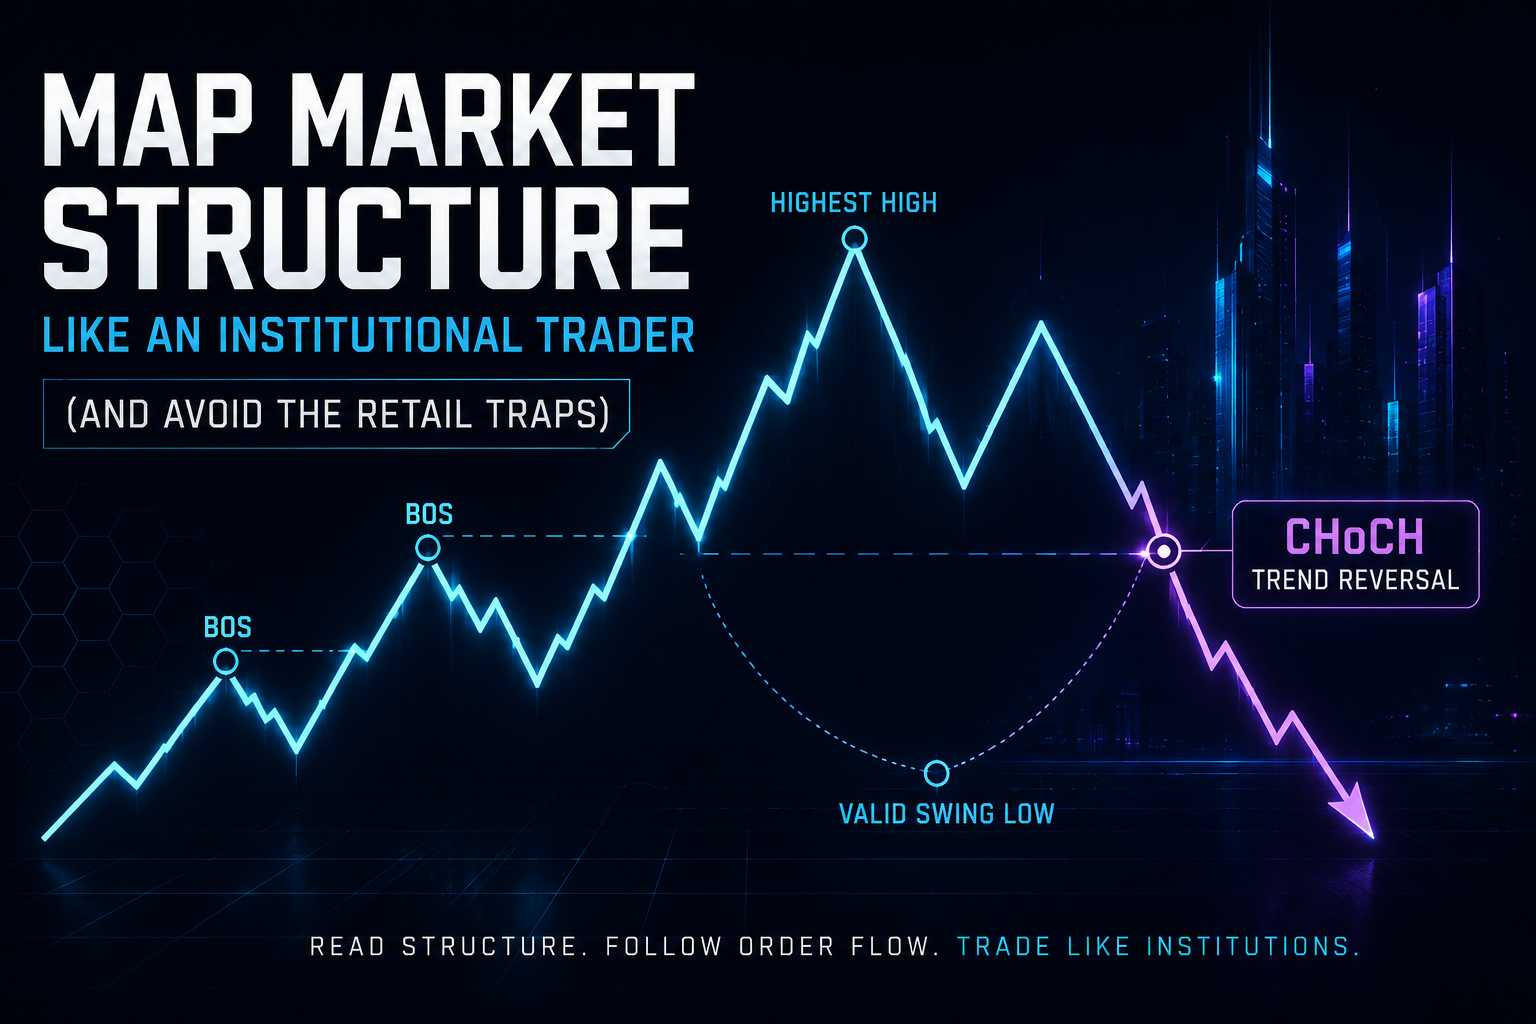
The truth is, algorithms and institutional market makers don’t look at basic trendlines. To stop being the “liquidity” for big banks, you need to understand how smart money actually views the market. This guide will break down how to map market structure like an institutional trader, specifically mastering the critical difference between a Break of Structure (BOS) and a Change of Character (CHoCH).
The Core Mechanics: BOS vs. CHoCH
To read a chart like an institution, you must stop treating every structural break with equal weight. There is a massive structural difference between a trend continuing and a trend reversing.
1. Break of Structure (BOS)
A Break of Structure occurs when the price breaks a swing high or swing low in the direction of the current dominant trend. It confirms structural momentum.
- In a Bullish Trend: A BOS happens when the price closes cleanly above the previous valid swing high.
- In a Bearish Trend: A BOS happens when the price closes cleanly below the previous valid swing low.
- The Institutional Meaning: A BOS tells you that the dominant order flow remains intact. Smart money is continuing to push the market in their intended direction.
2. Change of Character (CHoCH)
A Change of Character is the very first sign of a potential trend reversal. It occurs when the price breaks the last valid structural point that was responsible for creating the recent high or low.
- In a Bullish Trend: A CHoCH occurs when the price fails to make a new high and instead drops to close below the lowest valid swing low that created that highest peak.
- The Institutional Meaning: This signals that the order flow has aggressively shifted from buy-side to sell-side. Institutions are no longer defending their previous positions; they are actively reversing the market.

The Retail Trap: Why Your Cleanest Setups Are Failing
The biggest mistake retail traders make is misidentifying a minor structural break on a lower timeframe as a true market shift.
Institutions understand that retail traders place their stop losses just above clean double tops or recent swing highs. Therefore, an algorithm will often intentionally engineer a brief push past a structural high. To a retail trader, this looks like a breakout or a bullish BOS, inducing early buy orders.
In reality, it is simply a stop-run designed to capture liquidity before dropping the price hard.
💡 The Strategy Gap
Learning to map structure cleanly on a naked chart is the foundation, but applying it under strict trading parameters is where most hit a wall. If you are trying to utilize these institutional structure shifts to pass a prop firm evaluation, traditional risk management will get you flagged. To see exactly how to pair institutional market structure with bulletproof drawdown mechanics, read our step-by-step FB500 Funding Edge Passing Strategy.
The Step-by-Step Institutional Mapping Blueprint
To avoid fakeouts, follow this strict 3-step checklist to map market structure cleanly:
Step 1: Establish Your Higher Timeframe (HTF) Narrative
Never map structure exclusively on a 1-minute or 5-minute chart. Zoom out to the 4-Hour (4H) or 1-Hour (1H) chart to find the true macro trend. If the 4H chart is heavily bearish, any bullish breakout you see on a 5-minute chart is highly likely to be a trap or a minor pullback.
Step 2: Demand a Full Candle Body Close
This is a non-negotiable rule for institutional traders.
- If a candle spikes past a previous swing high but only leaves a wick before closing back inside the range, it is not a BOS. It is a liquidity grab.
- A structural break is only valid if the candle body closes completely outside the previous structural point.
Step 3: Identify the Source of the Move
When a valid CHoCH occurs, immediately look backward to find the exact unmitigated order block or demand zone that fueled that aggressive reversal. That “source” zone is where you will look for your entry when the price inevitably returns to mitigate the move.
The Bottom Line
Market structure isn’t just about drawing lines on peaks and valleys; it’s about reading the digital footprints of large institutional orders. By training your eyes to look for full candle body closes and ignoring minor inner-structure wicks, you insulate yourself from the fakeouts that wipe out the majority of retail accounts.
- Ready to Get Funded? If you want to stop guessing and start executing a mechanical, structured system designed specifically to clear evaluations without breaking daily loss limits, use the FB500 Funding Edge Blueprint.
- Need Right-Fit Trading Conditions? Institutional setups require zero-spread environments and instant execution to work effectively. Check out our fully vetted, unbiased platform recommendations on the ForexBroker500 Homepage to ensure your broker isn’t trading against your structure plays.
No responses yet