
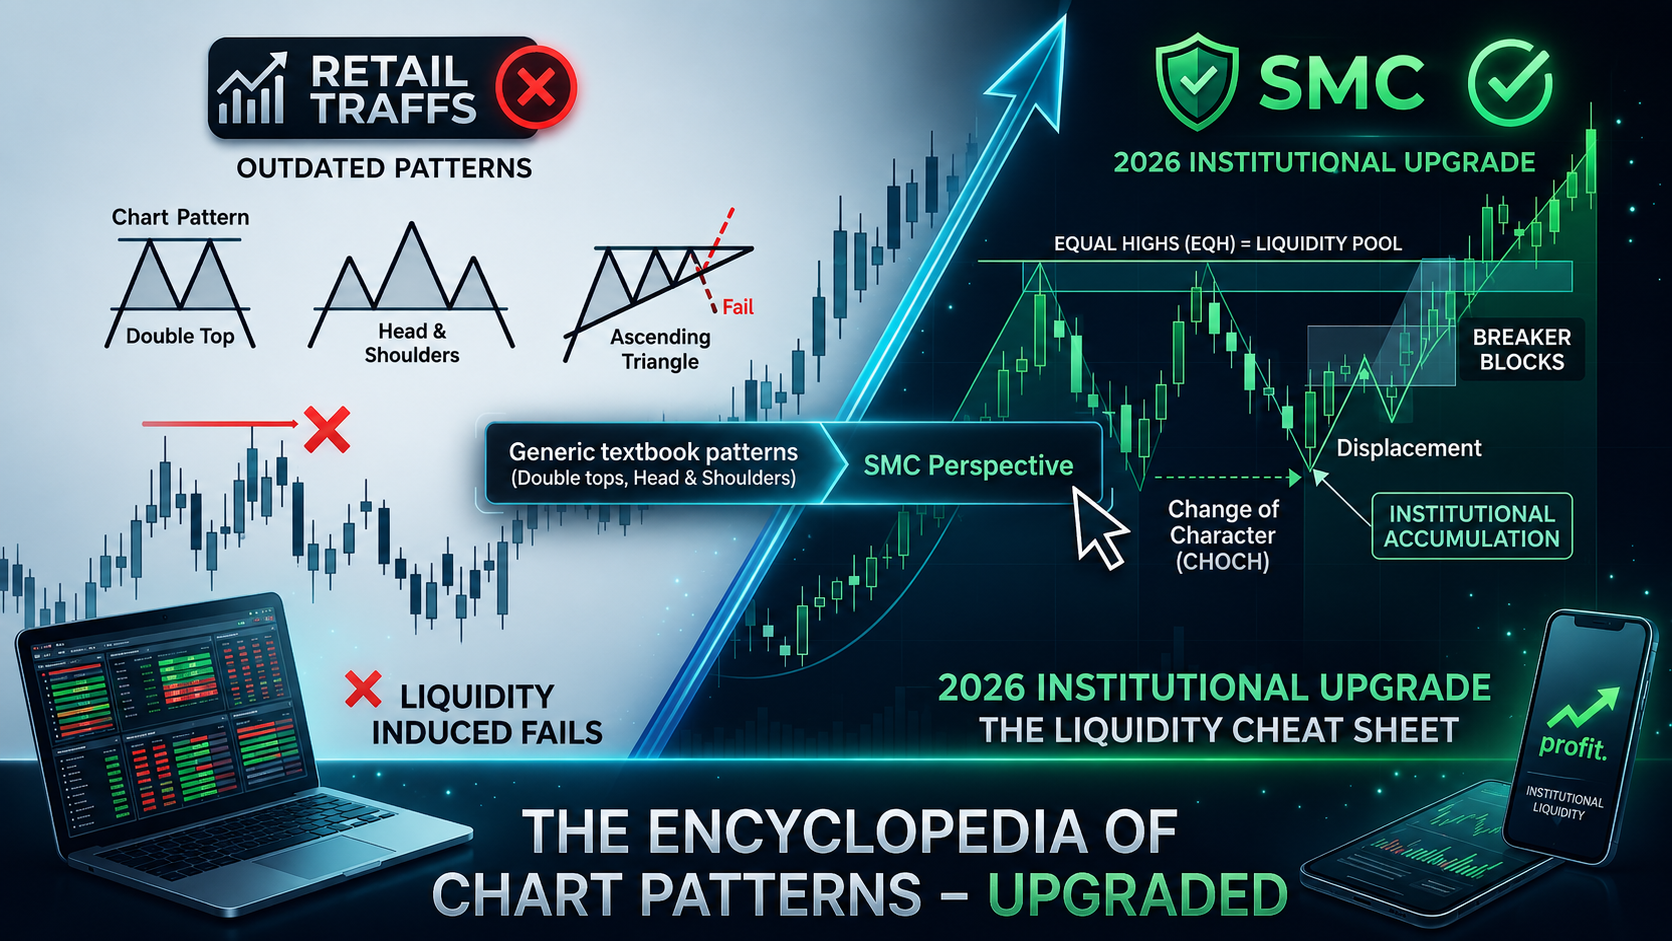
The Core Concept: Retail Patterns as “Liquidity Traps”
For a major bank or hedge fund to accumulate a multi-million dollar buy order, they require a corresponding cluster of sell orders—and vice versa—to prevent massive price slippage. Retail patterns provide these exact clusters with mathematical predictability.
Instead of viewing classic chart patterns as geometric setups, the 2026 Institutional Framework re-evaluates them through Smart Money Concepts (SMC) as engineered liquidity zones designed to match large institutional orders.

1. Double Tops & Bottoms → Equal Highs/Lows (EQH/EQL)
- The Retail Narrative: A strong resistance or support level where the market proves it cannot break through. Retail traders sell the second top, placing their protective stop-losses just above it.
- The Institutional Reality: The second top creates a dense pool of BSL (Buy-Side Liquidity) comprised of buy-stop orders. Institutions actively drive the price past these equal highs to trigger those buy stops. This injects the exact buy orders the algorithm needs to match its massive institutional short positions.
- The SMC Trade: Wait for the Liquidity Sweep (a sharp spike above the double top), followed by a lower timeframe CHoCH (Change of Character), then enter short on the return to the newly formed Bearish Order Block.
2. Head & Shoulders → The Neckline Breakout Inducement
- The Retail Narrative: A classic trend reversal pattern. When the “neckline” breaks, breakout traders jump in short, and conservative traders place stop-losses above the right shoulder.
- The Institutional Reality: The breakout creates an Inducement (IDM) layer. Institutions purposefully let the price drop below the neckline to trap breakout sellers, then pull the market back aggressively upward into a higher timeframe premium FVG (Fair Value Gap) or Order Block to clear out those early stops before the true downward expansion happens.
- The SMC Trade: Ignore the initial neckline break. Treat the right shoulder or neckline retest as an accumulation sweep. Look for price to sweep internal liquidity first, mitigate a clear structural POI (Point of Interest), and then ride the real expansion phase.
3. Support & Resistance Flips → Supply/Demand Mitigation Zone
- The Retail Narrative: “Old Support becomes New Resistance.”
- The Institutional Reality: These zones are often highly inefficient. Retail blocks form clean lines, while institutions trade from zones. What looks like a support flip is simply the market returning to mitigate a Breaker Block (a failed order block that was broken through with high institutional volume/displacement).
Quick Comparison Framework
| Retail View (Old Strategy) | Institutional SMC View (2026 Upgrade) | The True Market Objective |
| Double Top | Equal Highs (EQH) | Sweeping Buy-Side Liquidity (BSL) |
| Double Bottom | Equal Lows (EQL) | Sweeping Sell-Side Liquidity (SSL) |
| Trendline Bounce | Liquidity Trendline | Trendline Liquidity Build-up for a major sweep |
| Neckline Break | Retail Inducement (IDM) | Trapping breakout traders to engineer order flow |
The Golden Rule of 2026 SMC Order Flow: If you cannot spot where the liquidity is sitting on the chart, your stop-loss is the liquidity.
Upgrade Your Charting Toolbox
While understanding institutional liquidity is critical, finding these zones manually across dozens of pairs can be exhausting. To blend structural SMC analysis with powerful volumetric visualizers, you need the right tools on your charts.
📥 Download the Top 20 Trading Indicators for Free
Get instant access to a curated package of MT4/MT5 and TradingView indicators designed to automatically plot key structural zones, market sessions, and volume profiles, completely free.

No responses yet