Every aspiring funded trader knows the statistic: roughly 90% of people who buy a prop firm challenge fail it.
The retail trading world loves to blame this on “bad psychology” or “market manipulation.” But if you look under the hood, the real culprit isn’t a lack of discipline or a bad strategy. It’s simple, cold mathematics.
Prop firms don’t design their rules to bleed you dry; they design them to exploit the fact that most retail traders don’t understand risk of ruin. Let’s break down the exact mathematical traps engineered into these challenges—and how you can flip the script to join the 10% who actually secure capital.
1. The $100k Illusion (The 100% Return Trap)

When you purchase a $100,000 prop firm challenge, your brain anchors to that massive six-figure number. You start calculating how much money you’ll make on a 1% move.
This is the first major mistake.
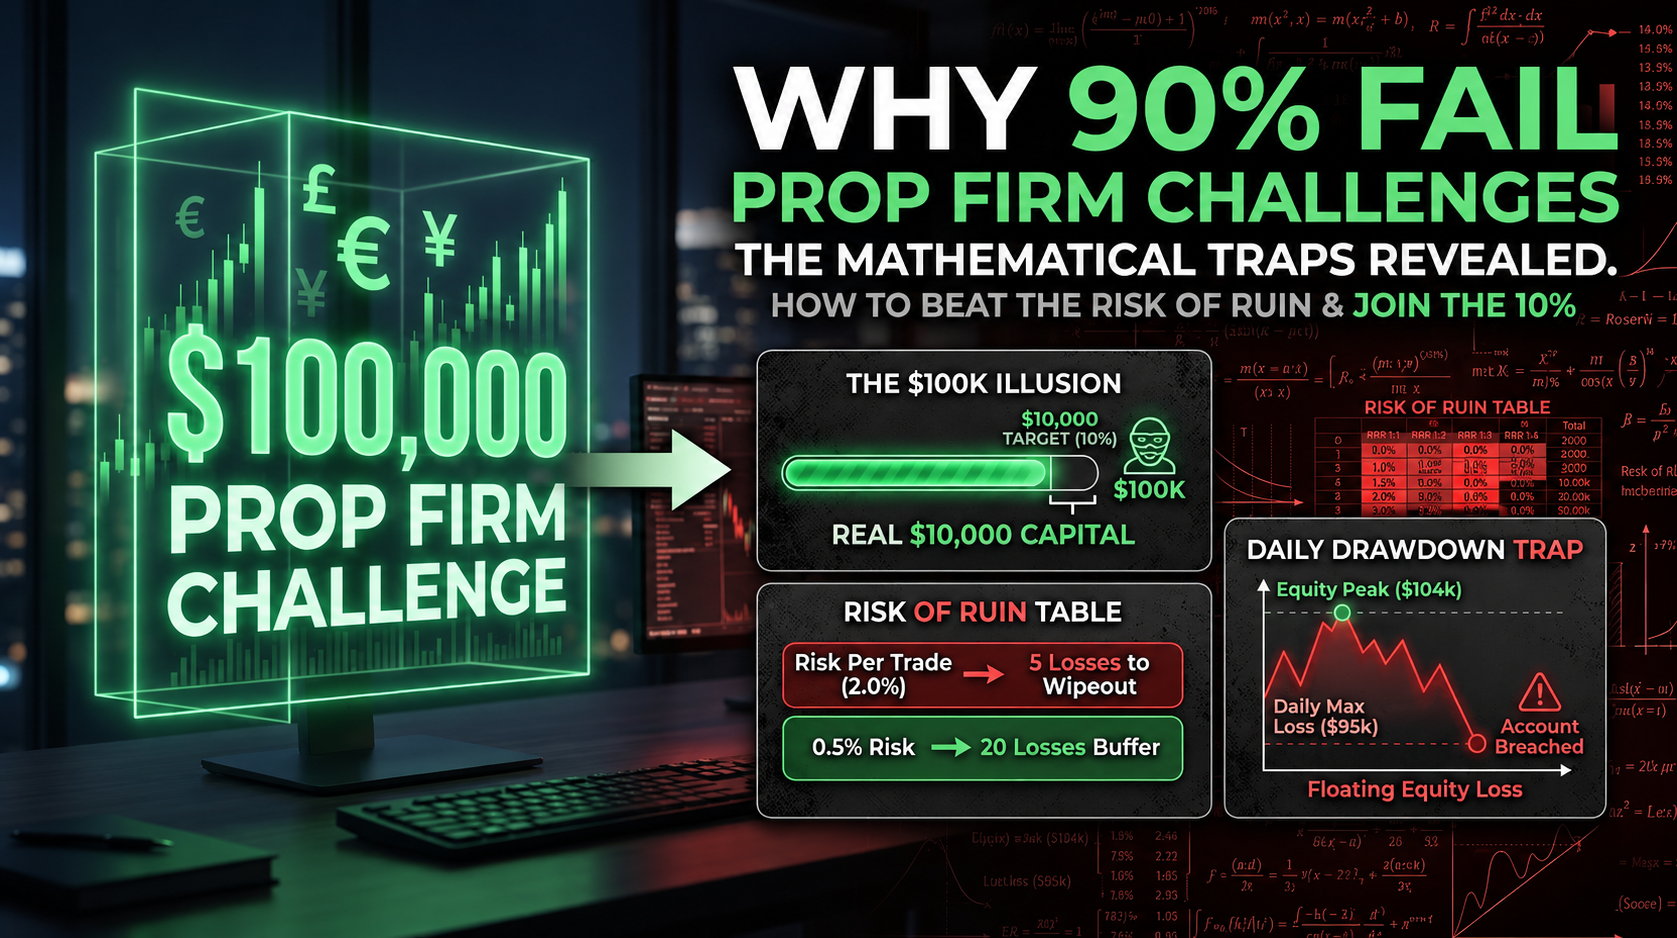
You do not have a $100,000 account. If the maximum overall drawdown limit is 10%, you have a $10,000 account wrapped in a $100k cosmetic skin.
Now, look at the phase 1 target: usually 10% ($10,000).
- To pass, you need to make $10,000 using your actual allowed risk capital of $10,000.
- Mathematically, you are not trying to make a modest 10% return. You are trying to make a 100% return on your real allocation.
When you realize you’re trying to double your real capital in a limited timeframe, risking 1% or 2% of the virtual $100k balance per trade suddenly looks suicidal.
2. The Risk of Ruin Table: How Fast You’ll Blow It
Most traders use a static lot size based on a traditional retail account. On a prop account, a small losing streak combined with aggressive lot sizing guarantees a breach.
Let’s look at how consecutive losses impact your maximum 10% drawdown allotment based on what you risk per trade:
| Risk Per Trade (of $100k Balance) | Real Risk of Your $10k Allocation | Consecutive Losses to Hit Max Drawdown | Psychological State |
| 2.0% | 20% of allocation | 5 Trades | Complete Panic / Revenge Trading |
| 1.0% | 10% of allocation | 10 Trades | High Stress / Hesitation |
| 0.5% | 5% of allocation | 20 Trades | Calm / Systematic Execution |
If you risk 2% per trade, a simple, normal five-trade losing streak wipes you out completely. Even a 1% risk per trade leaves you with an incredibly tight cushion. To protect your capital from these aggressive mathematical limits, you need an institutional blueprint built specifically for these constraints.
Before you buy your next challenge, make sure you are armed with a proven framework. You can explore our institutional price action mechanics and drawdown-safe models directly at Forex Broker 500.
3. The Daily Drawdown Trap: Equity vs. Balance
The daily max loss limit (typically 5%) is the sharpest trap in the evaluation process because it is usually calculated based on daily starting equity, not just closed balance.
Imagine this scenario:
- Your account starts the day at $100,000. Your daily max loss limit is $95,000.
- You enter a brilliant trade that flies up into a profit of $4,000. Your floating equity is now $104,000.
- You don’t close the trade. The market shifts, and that $4,000 profit completely evaporates, turning into a tiny floating loss of $1,500.
To you, you’re only down $1,500 from your starting balance. But to the prop firm’s automated dashboard, your equity dropped from a peak of $104,000 down to $98,500. That is a $5,500 drop in a single day.
Result: Account breached. Challenge failed.
How to Beat the Math: The 10% Blueprint
To beat a system engineered on tight mathematical boundaries, you have to fight back with flawless risk management and high-probability setups.
- Drop the Risk to 0.5%: Treat your account like a $10,000 allocation. Risking 0.5% gives you a 20-trade buffer, allowing you to weather normal market distributions without breaking a sweat.
- Demand a Minimum 1:3 Risk-to-Reward (RR): If you risk 0.5% ($500) to make 1.5% ($1,500), you only need a 33% win rate to stay profitable and march steadily toward your target.
- Stop Trading After One Good Win: If you hit a solid 1:3 RR setup early in the day, close down your charts. Do not expose your equity to the daily drawdown calculation.
If you are tired of being part of the 90% statistic and want to learn exactly how to map out liquidity pools, avoid inducement traps, and execute with an asymmetric edge, check out the step-by-step strategy we use to pass evaluations cleanly.
Gain the mathematical advantage and download the full breakdown here: FB500 Funding Edge Strategy.
No responses yet