Introduction
If you want to succeed in forex trading, you must learn how to read charts.
Forex charts show you:
- Price movement
- Market direction
- Trading opportunities
Without this skill, trading becomes guessing.
👉 The good news: reading charts is simpler than it looks.
What Is a Forex Chart?
A forex chart is a visual representation of price movement over time.
It shows:
- Price levels
- Trends
- Market behavior
👉 Traders use charts to decide when to buy or sell.
Types of Forex Charts
1. Line Chart
- Simple and clean
- Shows closing prices only
👉 Best for beginners
2. Bar Chart
- Shows open, high, low, and close
👉 More detailed than line charts
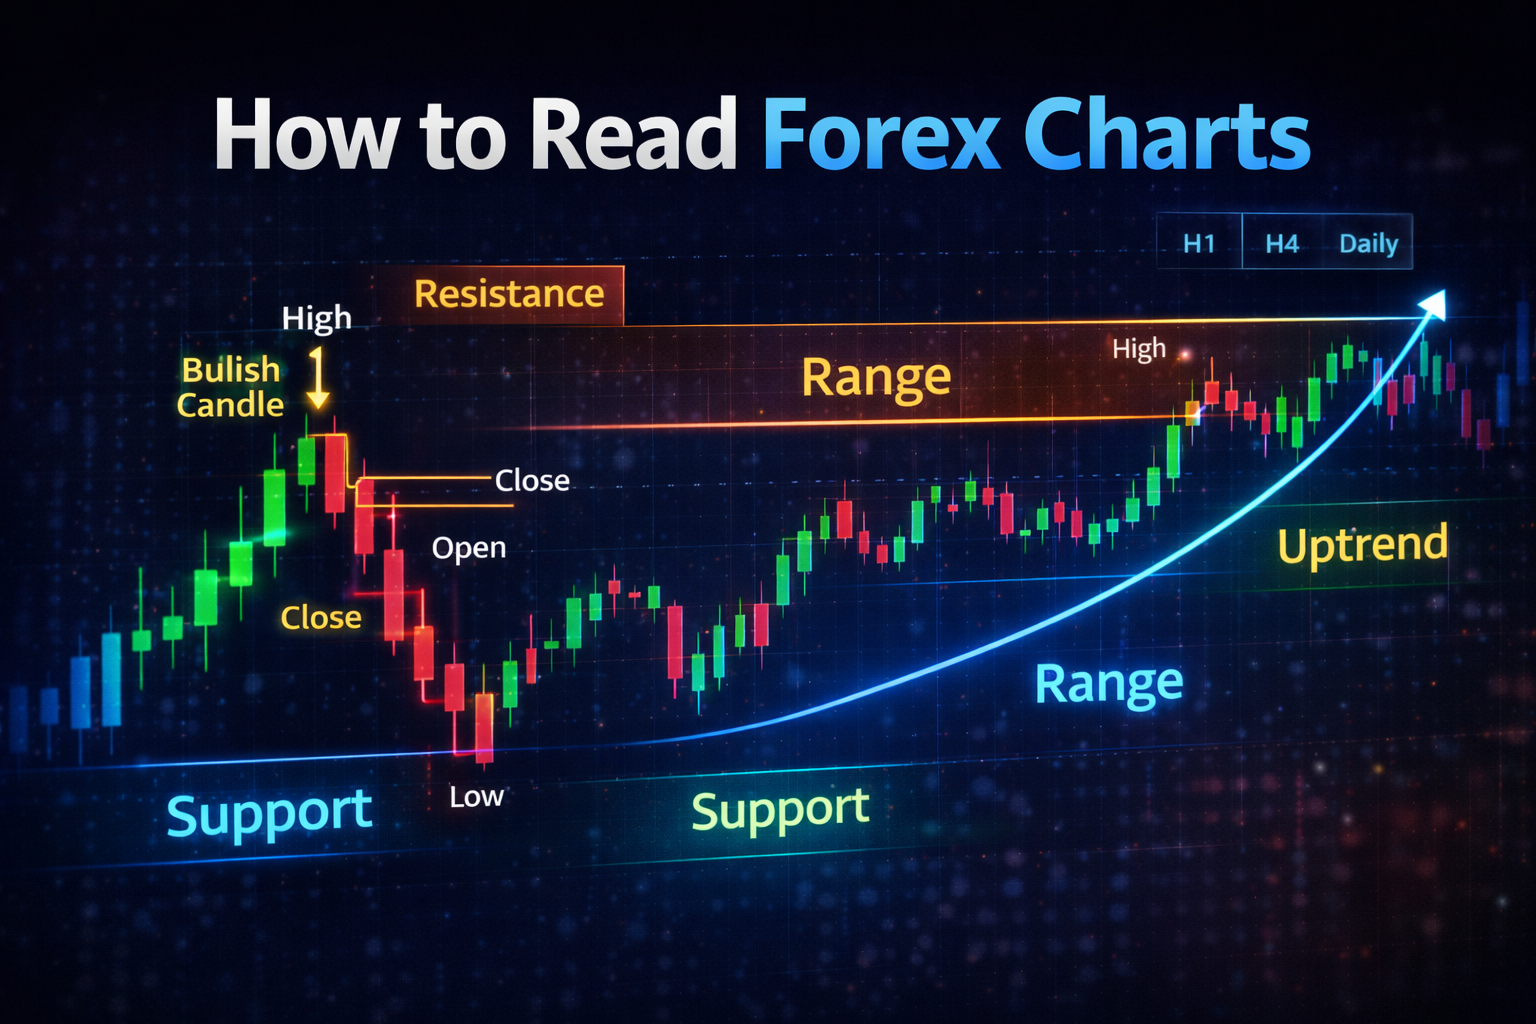
3. Candlestick Chart (Most Important)
This is the most popular chart type.
Each candle shows:
- Open price
- Close price
- High
- Low
👉 This is what most traders use.
How to Read Candlesticks
🟢 Bullish Candle
- Price closes higher than it opened
- Indicates buying pressure
🔴 Bearish Candle
- Price closes lower than it opened
- Indicates selling pressure
📌 Key Parts:
- Body → price movement
- Wick → price rejection
👉 Candlesticks tell you what buyers and sellers are doing.
Understanding Trends
Charts move in 3 ways:
📈 Uptrend
- Higher highs
- Higher lows
📉 Downtrend
- Lower highs
- Lower lows
➡️ Range
- Moves sideways
👉 Identifying trend = your first step before trading.
Support and Resistance
Support
- A level where price tends to stop falling
Resistance
- A level where price tends to stop rising
👉 These are key areas to enter or exit trades.
Timeframes Explained
Forex charts can be viewed in different timeframes:
- M1 (1 minute)
- M15 (15 minutes)
- H1 (1 hour)
- H4 (4 hours)
- Daily
👉 Beginners should focus on:
H1, H4, and Daily
How to Read Forex Charts (Step-by-Step)
Step 1: Identify the Trend
Look for higher highs or lower lows
Step 2: Mark Support and Resistance
Find key price levels
Step 3: Watch Price Action
Observe how price reacts at levels
Step 4: Wait for Confirmation
Don’t rush entries
Common Beginner Mistakes
❌ Overcomplicating charts
❌ Using too many indicators
❌ Ignoring trend direction
❌ Trading without confirmation
Pro Tip (Very Important)
Keep your charts clean.
👉 Price action is more important than indicators.
How This Connects to Other Concepts
Reading charts works together with:
👉 This is how you build a complete trading system.
Conclusion
Learning how to read forex charts is the foundation of trading.
Once you master this, you’ll:
- Understand the market better
- Make smarter decisions
- Avoid beginner mistakes
🚀 Start Practicing
👉 https://forexbroker500.com/
👉 https://toolkit.forexbroker500.com/
Use tools and resources to apply what you’ve learned.

No responses yet